


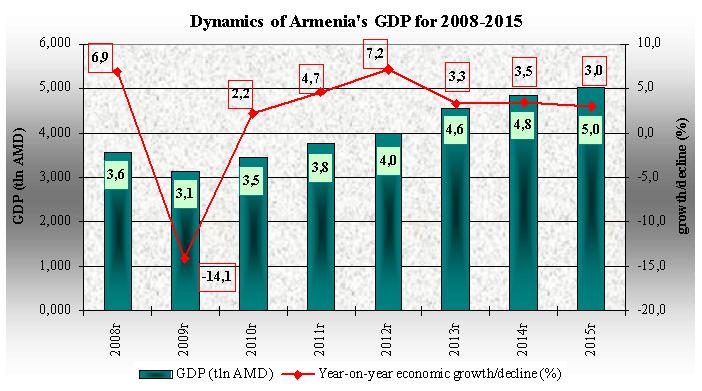
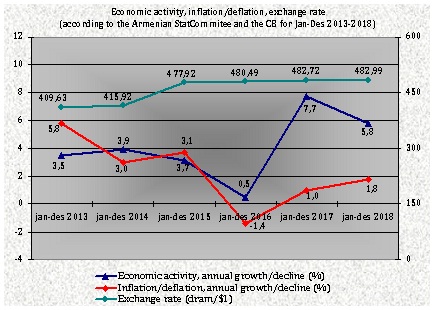
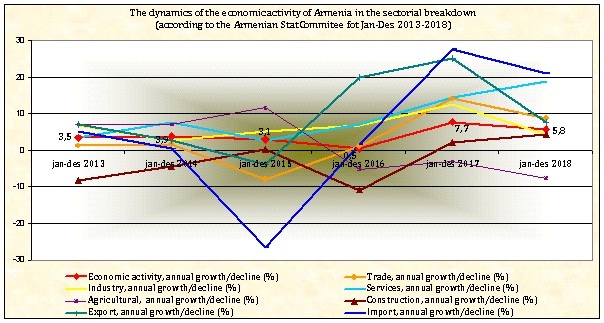
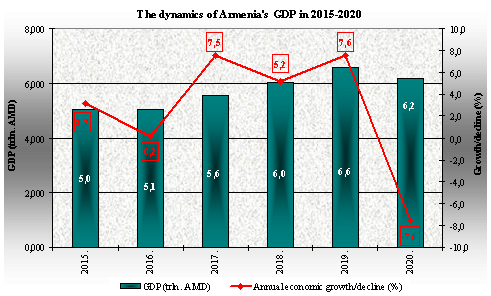
ArmInfo. Economic activity of Armenia increased 5.6% in Q1 2016, amid 26.3% growth of exports and 15.9% decline of imports. In March 2016 versus March 2015, this indicator increased 6.6%. For March alone, it grew 13.8%. A year ago, in Jan-Mar 2015 versus the same period of 2014, the economic activity increased 2.5%, in March 2015 versus March 2014 - 2.1%, and in March 2015 alone - 13.1%. For comparison, in 2014 the economic activity increased 3.3% in Jan-Mar year-on-year, 15.5% in March alone. In Jan-Mar 2013, this indicator increased 8.7% amid 14.6% growth in March alone.
By preliminary data of the National Statistical Service of Armenia, economic activity increased in Q1 2016 due to the following sectors: services - 9.6% y-o-y, industry - 8.9% y-o-y, energy - 5% y-o-y, agriculture - 3.3% y-o-y. Meantime, the trade sector showed downward trend again - 1.1% y-o-y. The construction sector suffered decline too - 2.2 y-o-y. A year ago, in Q1 2015 versus the same period of 2014, agriculture sector increased 4.5%, services sector - 3.9%, industrial sector and construction sector - by 2%, amid 12.6% decline of energy sectors and 6.3% decline of trade.
Industrial price index fell 3.9% in Jan-Mar 2016 versus the same period of 2015, 1.9% in March 2016 versus March 2015, and increased 0.9% in Arch 2016 alone. In Jan-Mar 2015 versus the same period of 2014, this indicator increased 5.4%, in Mar 2015 versus Mar 2014 - 4.8%, and in Mar 2015 alone it fell 0.5%.
In March, the construction, agriculture and trade sectors increased most significantly - 82.9%, 25.1% and 16.7% respectively (versus 86.6%, 24% and 16.2% a year ago, respectively). Industrial and services sectors increased 10.9% and 10.3% (9.2% and 9.7% a year ago respectively), amid 3.6% decline (4% growth in Mar 2015) of the energy sector.
In Mar 2016 versus the same period of 2015, the services sector increased 9.1%, the industrial sector 7.2%, agricultural sector - 4.4%, and energy - 1.1%, amid 0.1% and 5.8% decline of the trade and construction sectors, respectively.
In absolute terms, in Q1 2016, trade amounted to 434.6 bln AMD ($889.2 mln), industry - 305.3 bln AMD ($624.8 mln), services - 270.8 bln AMD ($554.1 mln), agriculture - 71.2 bln AMD ($145.7 mln), construction - 42.2 bln AMD ($86.3 mln). The electricity output totaled 1923.5 mln kWh, including 609.1 mln kWh in Mar 2016.
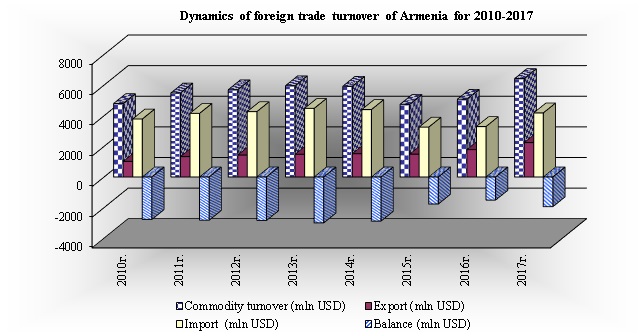
In Jan-Mar 2016, the foreign trade turnover amounted to 487.7 bln AMD ($997.1 mln), with a 3.8% decline versus y-o- y. Exports grew by 26.3% y-o-y to 183.8 bln AMD ($375.9 mln), and imports dropped by 15.9% y-o-y to 303.9 bln AMD ($621.2 mln). In Mar 2016, the foreign trade turnover increased by 2.9%, with exports growing by 9.6%, and imports falling 1.1%. As compared to Mar 2015, the foreign trade fell by 7% due to 21.5% decline of exports and 30.3% growth of imports.
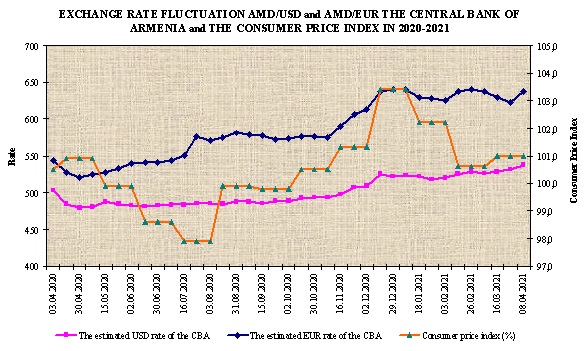
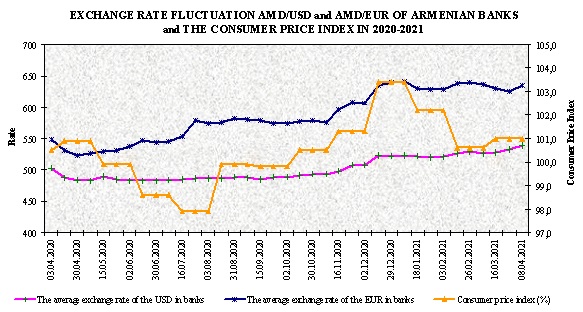
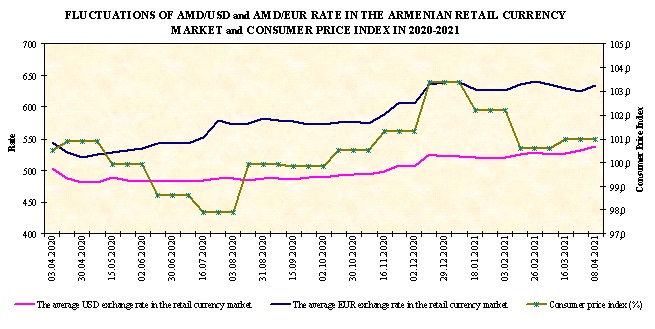
In Mar 2016, the average AMD/USD exchange rate was 486.33 AMD/1USD, in Jan-Mar 2016 - 488.67 AMD/1USD (versus 477.61 AMD/1USD in Mar 2015 and 477.26 AMD/1USD in Jan-Mar 2015). In Mar 2014 it totaled 414.22 AMD/1USD and in Jan-Mar 2014 - 411.04 AMD/1USD.


 Expert on Armenia`s international trade growth against "miserable trade pattern"
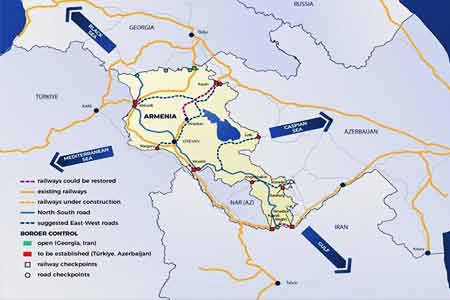
  Expert: Armenia should use Georgian, Turkish transit opportunities

 Gevorg Mantashyan: High-Tech Ministry makes consistent efforts for emergence and progress of startups in Armenia
 Bank of Georgia announces proposed acquisition of Ameriabank for $303.6 million
 Former MP on economic situation in Armenia: "What is brought by water will go with water"