

ArmInfo. In Jan-July 2016, the industrial produce in Armenia grew 7.9% versus Jan-July 2015 (against 4.1% growth a year before) to 777.4 bln drams ($1.6bln). Improvement of the manufacturing industry dynamics and retention of the mining growth trend speeded up industry rise in Armenia. According to the National Statistical Service of Armenia, in July 2016 alone, the industrial output decreased 6.2% (versus 2.6% decline in July 2015) to 117.7bln drams.
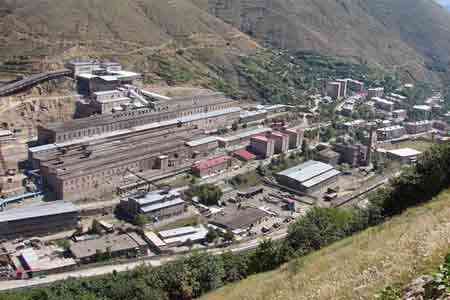
In Jan-July 2016 versus the same period of 2015, mining industry and open pit mining increased 19% (versus 34.4% growth a year before) to 144.3bln drams. In July alone, the mining industry output totaled 22.1bln drams with a 20.6% growth y-o-y. Manufacturing industry increased 3.5% y-o-y (vs 3.1% decline a year ago) to 469.01bln drams, of which 74.5bln drams - in July.
In Jan-July 2016, jewelry production grew by 80.8% as compared to Jan-July 2015 (versus 41.9% rise a year before), furniture production - by 42.8% (versus 25.6% rise a year before), clothing - by 32.7% (versus 2.4% rise a year before), cigarettes - by 13.6% (versus 52.1% rise a year before), production of computers, electronic and optical equipment - by 12.9% (versus 4.1% decline a year before), vehicles and equipment - by 10.4% (versus 4% rise a year before), beverages - by 8.2% (versus 22.1% decline a year before), food - by 6.4% (versus 9.6% decline a year before). In the meantime, production of finished metallic items dropped by 17.5% (down 15.8% a year before), base metals - by 10.7% (down 10.8% a year before), textile industry - by 7.3% (down 13.1% a year before). The food output totaled 162.4 bln AMD, base metals - 81 bln AMD, cigarettes - 66.3 bln AMD, beverages - 57.1 bln AMD and jewelry - 18.8 bln AMD.
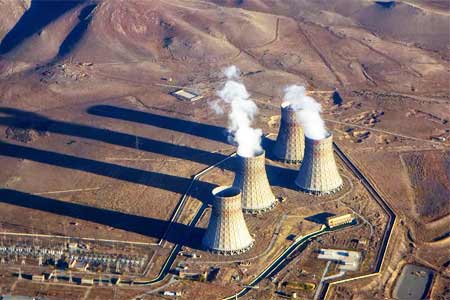
The supply of electric power, gas, steam and conditioned air increased by 12.3% in Jan-July 2016 versus Jan-July 2015 (vs 2.8% rise a year before) to 151.7bln drams. In July alone, this indicator grew by 8.1% to 19.3bln drams.
In Jan-July 2016, the revenues from water supply, waste disposal and recycling grew 7.1% (vs 10.2% growth a year before) to 12.5 bln AMD (up 3.6% in July alone to 1.9 bln AMD).
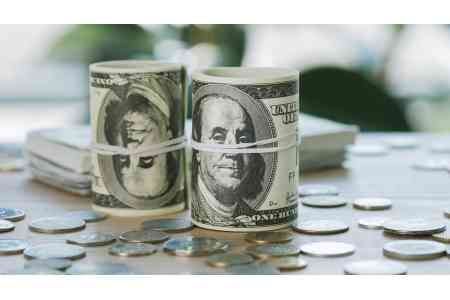
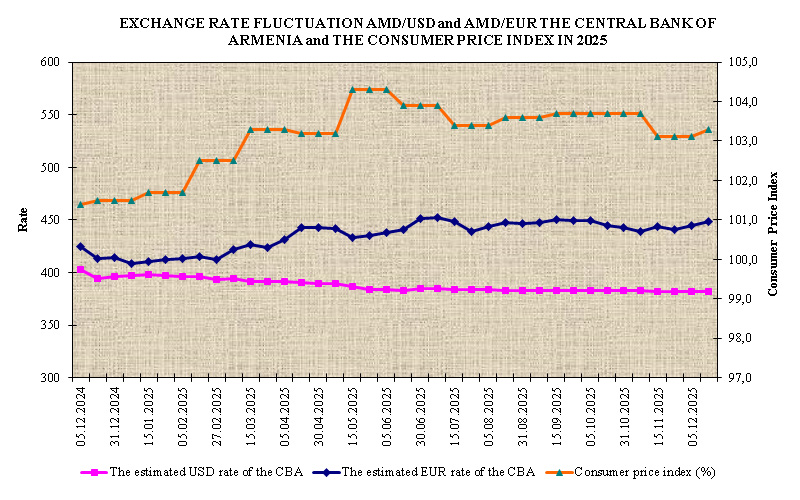
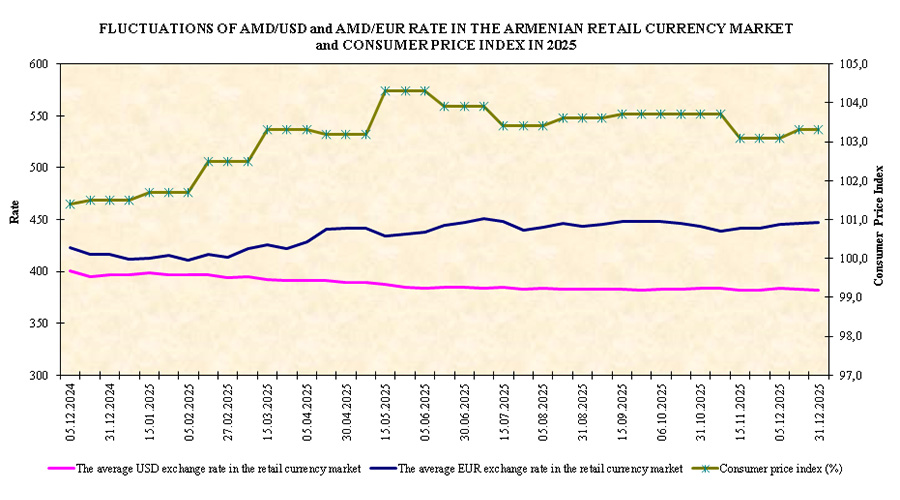
The average AMD/USD exchange rate was 476.52 AMD/$1 in July 2016 and 482.81 AMD/$1 in Jan-July 2016 versus 477.33 AMD/$1 in July 2015 and 476.93 AMD/$1 in Jan-July 2015.