

ArmInfo. In Armenia, economic activity in January-November 2021 increased by 5.2% per annum (against a 7.2% decline in the same period of 2020), while in the pre- COVID period it has7.5% growth (in the same period of 2019). ). This was observed against the backdrop of the exit of exports and imports from the recession to double-digit growth, while in the pre-COVID comparable period, the growth of these indicators was much more modest. This is evidenced by the preliminary data of the RA Statistical Committee.
According to statistics, in November of this year by November 2020, economic activity increased by 13.2% (against a 10.3% decline a year earlier and a 10.1% growth in the pre-COVID period), with a continued monthly decline with a slowdown from October 4.9% to November 1.4% (versus 10.2% decline in November 2020 and 8.5% decline in November 2019).
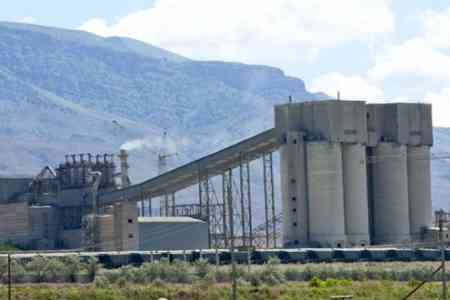
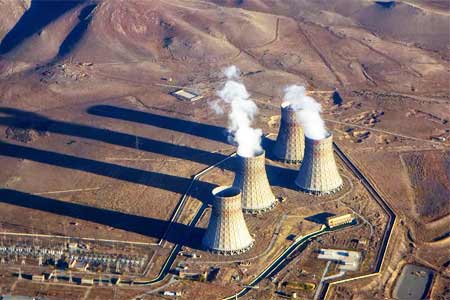
The drivers of economic activity growth in January-November 2021 were mainly the trade sector, the service sector and the construction sector - respectively with upward rates of 7.9%, 7.3% and 6.9%, and to a lesser extent the industrial sector with growth production volume by 2.7% . Only the energy complex was in decline - by 2%. A year earlier, in January-November 2020, only the energy complex was able to maintain growth - by 1.8%, while the rest of the industries were in decline: the service sector - by 13.6%, the trade sector - by 13.5%, the construction sector - by 11.2%, industrial sector - by 0.2%. And two years earlier, in January-November 2019, the growth of economic activity was determined by the service sector - by 14.8%, the industrial sector - by 9.3%, trade - by 9.2%, the construction sector - by 4.5%, with a decline power complex by 3.4%. For the agricultural sector, only quarterly data are published.
The industrial product price index increased by 9.9%, in January-November 2021 compared to the same period in 2020, with such an increase in November 2021 compared to November 2020 - by 9.9%, while in November 2021 alone it did not change (after October 0.2% growth). A year earlier, in January-November 2020 compared to the same period of 2019, the industrial product price index increased by 2.2%, in November 2020 compared to November 2019 - by 4.5%, and in November 2020 alone- by 0.9% (after October decline by 0.7%). Two years earlier, in January-November 2019 compared to the same period in 2018, the industrial product price index increased by 0.4%, in November 2019 compared with November 2018 it decreased by 0.6%, and in November 2019 alone it increased by 0.5%.
On monthly terms (for November), all industries showed growth, except for the service sector, which slowed down to 1% from 1.5% in October. Thus, the energy complex accelerated growth in November to 17.7% (from October 5.8%), the construction sector - to 14.4% (from October 4.2%), the industrial sector - to 13.8% (from October 9, 6%), while the retail sector registered a positive growth of 3.8% out of negative 3.8% in October. A year earlier, in November 2020, only the service sector was in decline (2.8%), and the rest of the industries showed growth: the industrial sector accelerated the pace to 4% (from October 3.2%), the construction sector - to 10% (from October 3%), while trade and the energy complex reached positive 1% and 1.9%, respectively (out of negative 13.4% and 1.8% in October). In the pre-COVID comparable period, in November 2019, the sectors that showed growth were the construction sector - 8.9%, the industrial sector - 6.9%, the energy complex - 1.7% and the trade sector - 1.5%, and the service sector was in decline by 8, 4%.
On a y-o-y terms (November 2021 to November 2020), all industries showed growth: the service sector - by 16.9%, the trade sector and the industrial sector - by the same 15.7%, the construction sector - by 10.8% and the energy complex - by 8, 3%. A year earlier (November 2020 to November 2019), the retail sector fell by 22%, the service sector - by 18.6% and the industrial sector - by 6.1%, while the energy complex continued to grow - by 3.1% and the construction sector - by 2%. Two years earlier (November 2019 to November 2018), only the energy complex was in decline - by 9.3%, while other sectors showed growth: industry - by 13.8%, trade - by 11.9%, services - by 11.6%, construction - by 4.8%.
According to statistics in January-November 2021, the absolute leadership is held by the trading sector with a volume of 2.996 trillion drams ($ 5.9 billion). The second place was held by the industrial sector with a volume of 2.105 trillion ($ 4.2 billion), the services sector held the third - 1.693 trillion drams ($ 3.3 billion), the fourth, due to the lack of data on the agricultural sector, is occupied by the construction sector - 365.8 billion drams ($ 723.6 million). The volume of electricity generation in January-November 2021
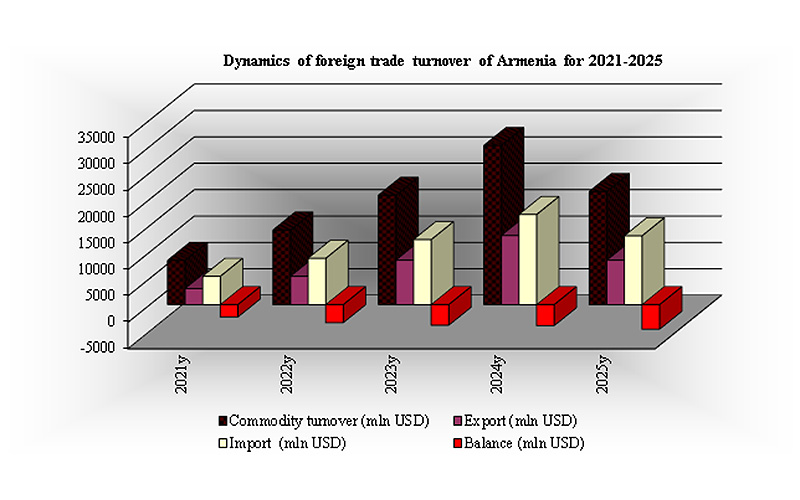
Armenia's foreign trade turnover in January-November 2021 amounted to 3.7 trillion drams ($ 7.4 billion), with a y-o-y growth of 16.6%. This was accompanied by a more significant growth in exports - by 19.4% to 1.4 trillion drams ($ 2.7 billion), and a slightly less modest increase in imports - by 15.1% to 2.4 trillion drams ($ 4.7 billion). In November 2021, the growth of foreign trade turnover slowed down from 12.5% to 8.5%, due to the same movement of the upward trend in exports - from 16.7% to 10.9% and imports - from 10.5% to 7.2%.
And in November 2021 compared to November 2020, the jump in foreign trade turnover by 44.6% was almost equally due to the growth of imports by 45.9% and exports by 42.1%. A year earlier, in January- November 2020, the decline in Armenia's foreign trade turnover by 12.4% was provoked by the subsidence of both imports - by 15.9%, and exports - by 5.2%, in November alone, the decline in foreign trade turnover accelerated from 2.9 % to 5% came from the reversal of the dynamics of imports from 2.3% growth to 2.6% decline, and the delayed export decline with a slowdown from 11.1% to 9.4%, and compared with November in 2019, foreign trade turnover decreased by 25.9% due to a decline in imports by 28.9% with a decline in exports by 19.4%.
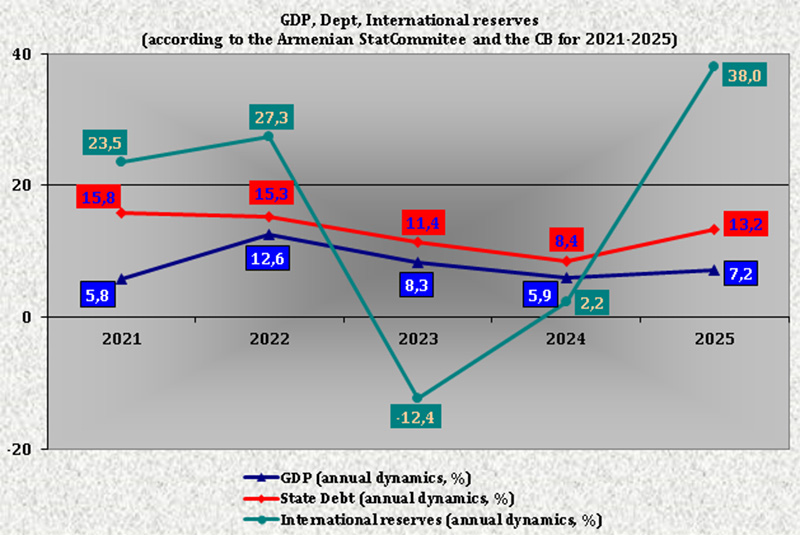
In the pre-COVID comparable period, the dynamics of foreign trade was as follows: in January-November 2019, the growth of foreign trade turnover by 7.4% came from an increase in exports by 9% and imports by 6.6%, in November alone, foreign trade turnover increased by 4.5% due to the growth of exports by 8.5% and imports by 3.1%, and compared to November 2018, the growth of foreign trade turnover by 14.2% was to a greater extent provoked by the growth of exports by 25.7%, rather than imports by 9.6 %. (The average calculated exchange rate of the dram was 477.66 AMD / $ 1 in November 2021, and 505.46 AMD / $ 1 in January-November 2020). According to the IMF forecast updated in November of this year, GDP growth in Armenia in 2021 will be 5.5% with a slowdown in 2022 to 5.3%. According to the October forecast of the World Bank, GDP growth in Armenia in 2021 will be 6.1% with a slowdown in 2022 to 4.8%. And according to the forecast of the Central Bank of the Republic of Armenia, updated in mid-December of this year, GDP growth in Armenia in 2021 will be 4.2%. The state budget of the Republic of Armenia for 2021 provides for a GDP growth of 3.2%, and for 2022, the state budget provides for a 7% GDP growth. And this is after the actual decline in GDP in 2020 by 7.4%, and the pre-COVID GDP growth in 2019 by 7.6%.