

ArmInfo.In Armenia, in January-February 2022, the energy complex and the service sector were the drivers of double-digit growth economic activity - by 12% per annum.
As a comparison, we note that a year earlier, in January-February 2021, economic activity was in decline by 6.7%, a more modest increase in this indicator was recorded in the pre-Covid comparable period (January-February 2019) - by 6.5%. In February 2022, compared to February 2021, economic activity increased by 9% (against a 5.3% decline a year earlier and a 7.6% growth in the same period in 2019), and energy complex and the service sector acted as drivers in this case as well. And in February alone, thanks to the high growth rates of the construction and trade sectors, economic activity increased by 6%, against the 12.4% growth in February 2021 and the 9.3% growth in February 2019. This is evidenced by the final data of the RA Statistical Committee.
According to statistical data, in January-February, the largest y-o-y growth, moreover, double-digit, was shown by the energy complex - 21.9% and the service sector - 20.1%, followed by the industrial sector - 9.7%, the trade sector - 8.2% and the construction sector - 4.9%. Data for the agricultural sector have not been published. A year earlier (January-February 2021 versus January-February 2020), only the construction sector showed growth, but with a strong slowdown to 1%, while other industries were in decline: the service sector - 12.5%, the trade sector - 11.3%, industrial sector - 7.9%, energy complex - 5.8%. As a comparison, we note that in the same period of pre-Covid 2019, the construction sector provided the largest growth - by 21.6%, the service sector - by 17.5%, the trade sector - by 13.1%, which compared to which the industry sector showed incomparably lower growth rates - 1.9%, and the energy sector showed a 21% decline.
In y-o-y terms (February 2022 to February 2021), the energy complex and the service sector also showed the largest growth - 25.1% and 19%, respectively, while a year earlier it was in these areas that the largest decline was recorded by 13.7% and 12.2 %. A more modest growth was provided by the construction sector, the trade sector and cthe industrial sector - 6.3%, 5.3% and 3.7%, respectively, and compared to the dynamics of the previous year, there is an improvement, in particular in the construction sector - an acceleration from the previous 1 .1%, and in the trade sector and the industrial sector - a change from a 7.8% and 5.1% decline, respectively.
For the same period of the pre-Covid 2019, growth was demonstrated y the construction sector - by 21.3%, the service sector - by 19.3%, the trade sector - by 8.3%, the industrial sector - by 4.7%, and the energy complex was in decline by 14.5%.
In February 2022, the only decline was observed in the energy complex - by 10.3%, while growth was recorded in other sectors, while only construction and trade showed high rates - 30.8% and 11.9%, respectively, while the industrial sector and the service sector showed the same rates 1.4%. A year earlier, in February 2021, the only decline was also observed in the energy complex - by 14.5%, while other areas showed growth: the construction sector - 28.4%, the trade sector - 19.7%, the industrial sector - 15.3%, the service sector - 4.3%. In pre-Covid 2019, in February, the largest growth was also shown by the construction and trade sectors - 29% and 18.4%, respectively, followed by the industrial sector - 8.9% and the service sector - 5.4%, and the energy complex was then in decline by 6.1%.
The industrial products price index increased in January-February 2022 by 10.7% per annum, with an increase in February by 3.7% and a y-o-y growth of 12.3% (February 2022 to February 2021). A year earlier, in January-February 2021, an increase in the price index of industrial products by 6.2% per annum was recorded, with an increase in February by 0.5%, and an increase compared to February 2020 by 7%.
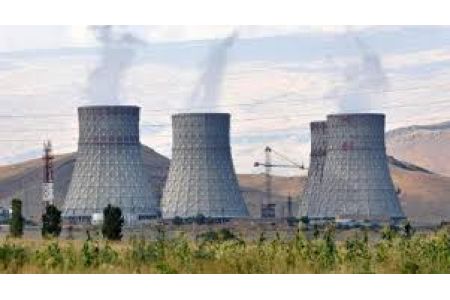
In January-February 2022, the absolute value is held by the trade sector with a volume of 489.5 billion drams ($1.02 billion). The industrial sector with a volume of 365.3 billion ($759.2 million) is in the second place, the service sector in the third - 316.3 billion drams ($657.4 million), and due to the lack of data from the agricultural sector traditionally occupying this place, the construction sector is in the fourth place, with a volume of 32.7 billion drams ($68.04 million). The volume of electricity generation in January-February 2022 amounted to 1678.9 million kWh, of which 793.7 million in February.
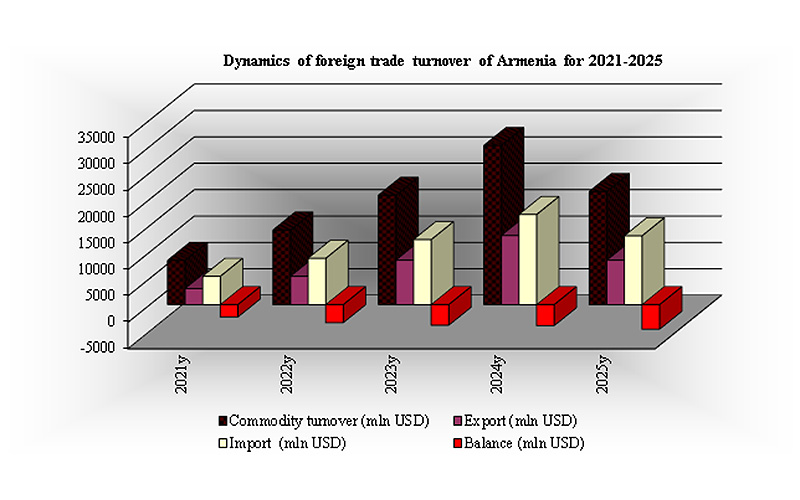
At the same time, Armenia's foreign trade turnover in January-February 2022 amounted to 683.5 billion drams ($1.4 billion) with a y-o-y growth of 52.4%. This was the result of high growth in both exports - by 40.1% to 242.4 billion drams ($503.7 million), and imports - by 60.2% to 441.1 billion drams ($917 million). In February 2022 alone, foreign trade turnover increased by 11.9% due to an increase in imports by 17.7% and exports by 2.1%. In February 2022, compared to February 2021, the growth of foreign trade turnover by 44.9% was provoked by an increase in imports by 54.7% and exports by 29.1%. A year earlier, in January-February 2021, the foreign trade turnover was in decline by 12.2% due to a decline in exports by 5.5% and imports by 15.8%, only in February 2021 the growth of exports and imports by 21.8% and 26 .9%, respectively, led to an increase in foreign trade turnover by 24.9%, and compared to February 2020, a decline in imports by 13.6% and exports by 2% provoked a decrease in foreign trade turnover by 9.5%.
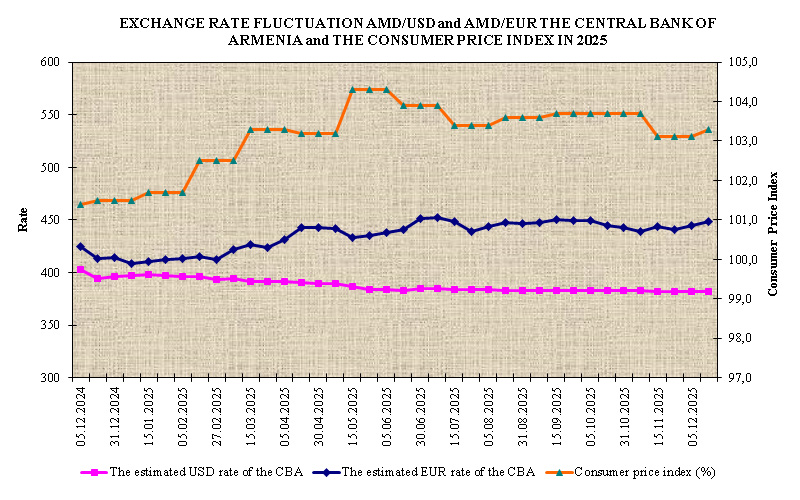
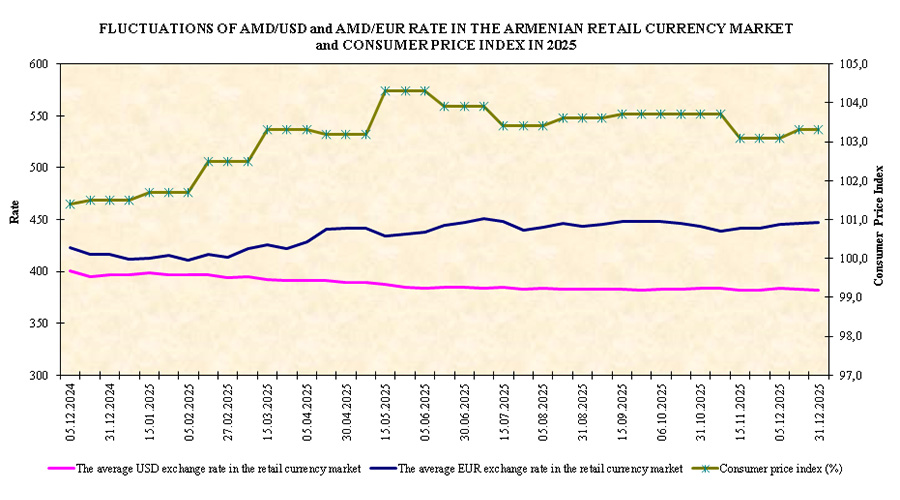
The average settlement rate of the dram in January-February 2022 was 481.12 AMD/$1, and in February 2022 - 480.24 AMD/$1, against 522.37 AMD/$1 in January-February 2021 and 523.54 AMD/$1 in February 2021