


ArmInfo. In Armenia, economic activity growth accelerated to 7.4% annually in January-February 2026 (from 4.1% in the same period of 2025). Moreover, the industrial sector once again became one of the growth drivers, compared to a double-digit decline the year before. According to preliminary data from the RA Statistics Committee, this was accompanied by an improvement in foreign trade, with a significant decline returning to moderate growth.
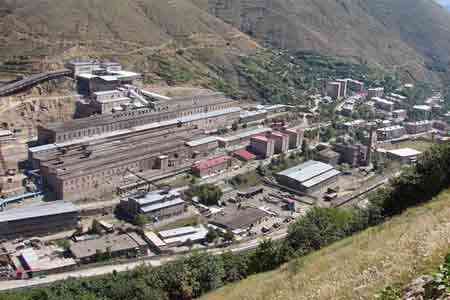
According to statistics, the acceleration in economic activity growth in January-February 2026 was largely due to an improvement in the annual dynamics of the industrial sector, from a 19.4% decline to 17.2% growth, and an even faster acceleration in the construction sector, from 12.2% to 20.5%. Annual growth in the energy sector also accelerated, from 6.9% to 7.1%. Meanwhile, annual growth in trade continued to slow, from 7.8% to 3.3%. This was also observed in services, from 12.4% to 7.2%. Agricultural sector dynamics are not included in this statistical report.
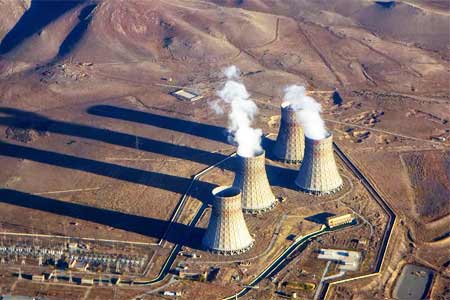
According to statistical data for January-February 2026, the trade sector holds the lead in absolute value with a volume of 892.2 billion drams ($2.4 billion). Second place by volume goes to the services sector with 630.3 billion drams ($1.7 billion), third to the industrial sector with 491.5 billion drams ($1.3 billion), and fourth, due to the lack of agricultural sector data, goes to the construction sector with 53.95 billion drams ($142.4 million). Electricity generation in January-February 2026 amounted to 1,823.9 million kWh, of which 785.4 million kWh in February alone.
At the same time, economic activity also accelerated in February 2026 compared to February 2025, growing by 7.2% (from 1.5% a year earlier), and in February alone, growth accelerated from a 48.3% decline to 4.5% (compared to a 5.3% decline in February 2025). Moreover, industrial sector growth improved in February 2026, rising from a 56.7% decline to 12.2% growth, compared to a decline of 41.3% to 0.6% a year earlier. In February, in addition to the industrial sector, growth was also observed in the trade and construction sectors, while a slowdown in the decline in the service sector and a decline in electricity generation volumes were observed.
On an annual basis (February 2026 to February 2025), all sectors demonstrated an upward trend, with the exception of the energy sector, which experienced a decline (4.7%). Specifically, the industrial and construction sectors demonstrated the highest annual growth rates - 23.8% and 21.8%, respectively, followed by the services and trade sectors - 7% and 5.6%, respectively. A year earlier, in February 2025 to February 2024, almost all sectors, with the exception of the industrial sector, which experienced a decline (26.6%), demonstrated growth: construction - by 12.7%, services - by 12.1%, trade - by 6%, and energy - by 5.8%.
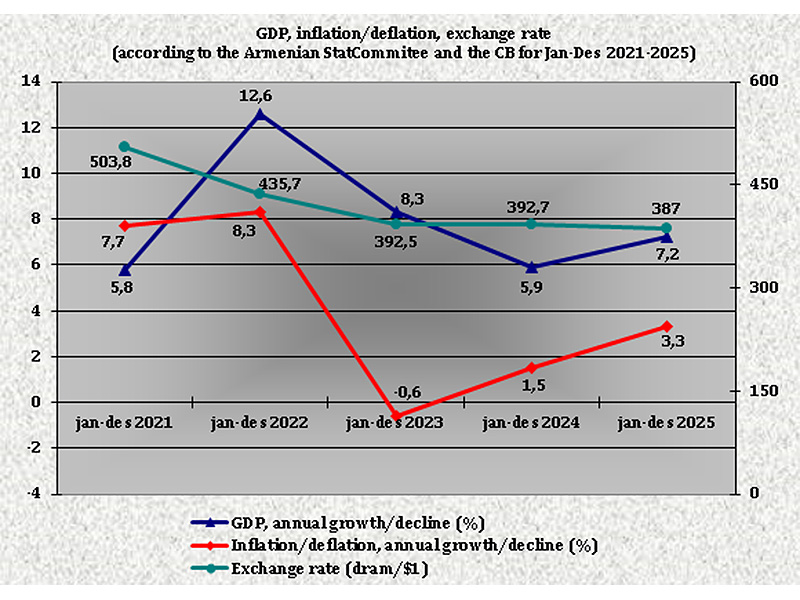
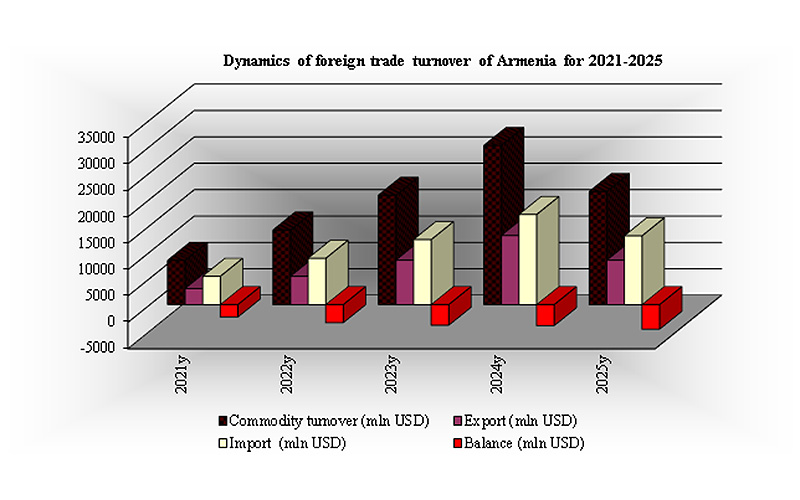
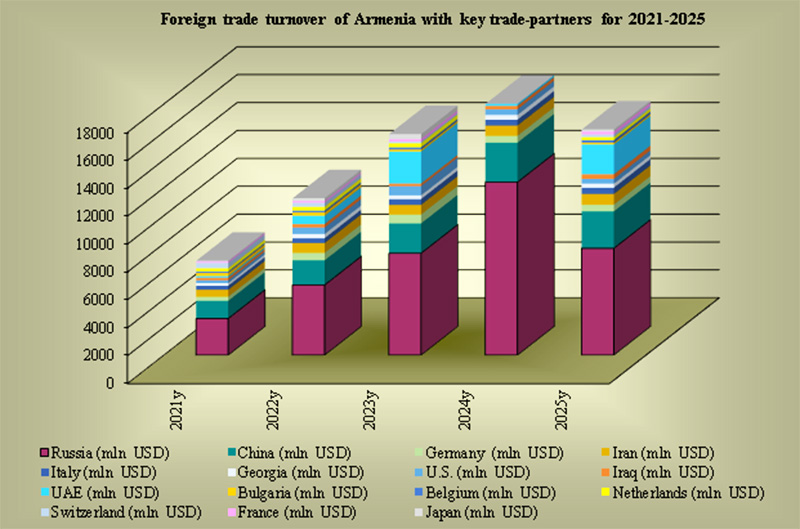
Against this backdrop, Armenia's foreign trade turnover in January-February 2026 amounted to 1.2 trillion. AMD ($3.1 billion), an increase of 9.3% year-on-year (versus a 52% decline a year ago). This is due to the growth of both exports and imports, which increased by 12.6% and 7.3% year-on-year, respectively (compared to declines of 59.7% and 45.8% a year ago). As a result, the absolute value of exports amounted to AMD 442.5 billion ($1.2 billion), and imports amounted to AMD 717.6 billion ($1.9 billion). In February 2026, compared to February 2025, foreign trade turnover increased by 30.8%, driven by a 37.6% increase in exports and a 26.9% increase in imports. A year earlier, in February 2025, compared to February 2024, foreign trade turnover fell by 61% due to a significant decline in exports by 67.7% and imports by 55.2%.
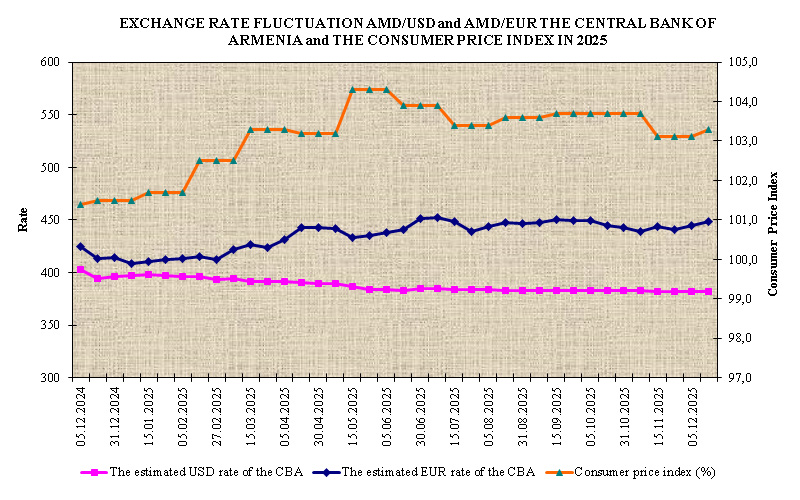
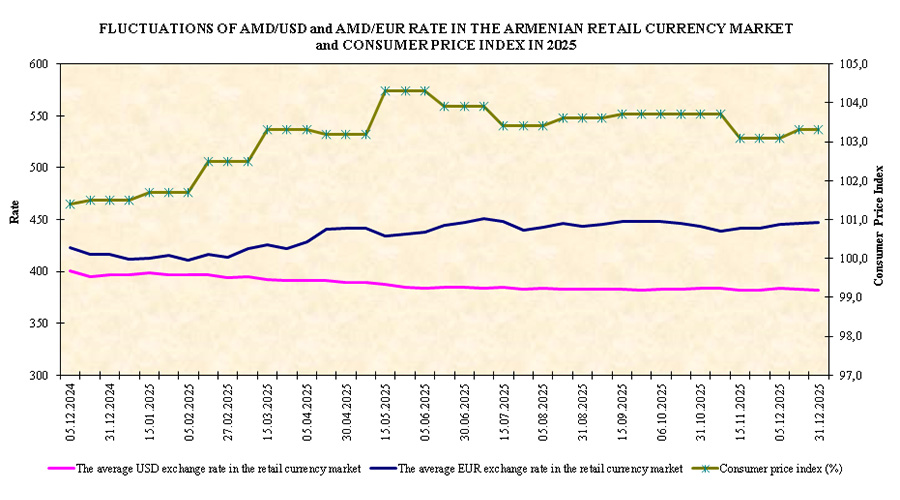
Starting in 2023, the methodology for calculating electricity generation volumes in statistical reports has changed; in particular, the volume of electricity generated by autonomous generators has now been included. For the agricultural sector, data is published only in quarterly and annual statistical reports. (The average dram exchange rate in January-February 2025 was 378.76 drams per US dollar.)