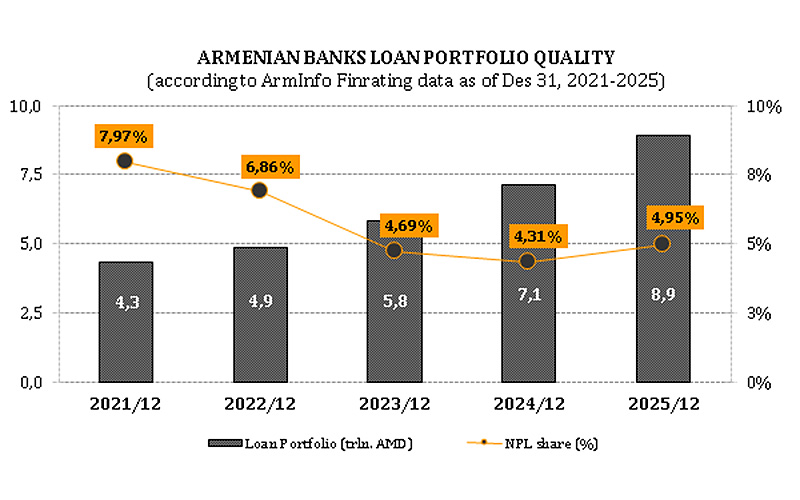



ArmInfo.The Armenian banking system has seen a high growth rate of non-performing loans (NPLs) for the second consecutive year. This trend is highlighted in the Financial Rating of Armenian Banks as of June 30, 2026, prepared by IC ArmInfo based on published financial statements and additional requested data (including credit risk data). Analysts note that NPL growth, which slightly slowed from 39% to 32% year-on-year by mid-year, is nevertheless increasingly weighing on profits due to write-offs.
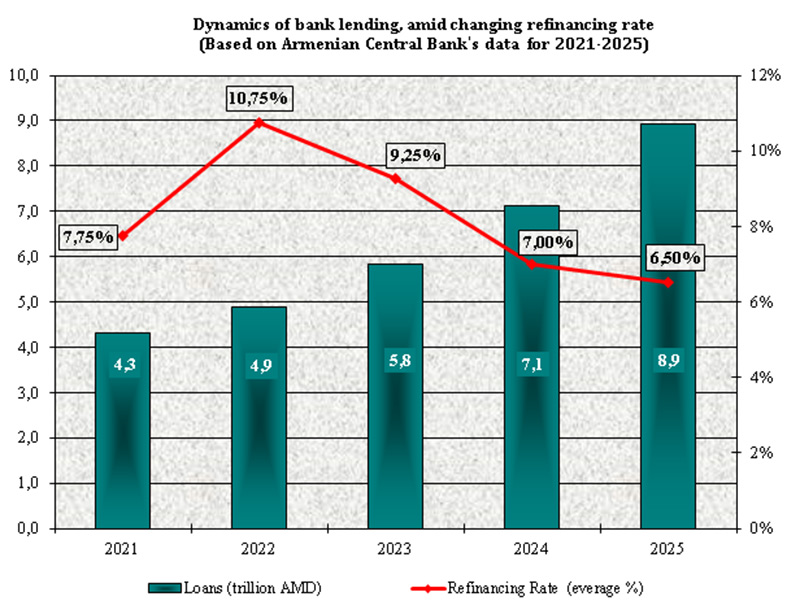
Meanwhile, the total loan portfolio accelerated to a 30% growth rate during this period. However, its core structure shifted: both corporate and retail lending grew at a slower pace, hitting 23–24% (compared to 28–29% a year ago). In contrast, interbank lending surged nearly threefold. For borrowers, this indicates a shortage of funds to meet current obligations and maintain liquidity, while for lenders, it represents a rational allocation of temporarily free cash.
As a result, the loan portfolio reached AMD 9.9 trillion ($26.8 billion) by July 1, 2026. This includes corporate loans of AMD 4.9 trillion ($13.5 billion), retail loans of AMD 4.1 trillion ($11.1 billion), and interbank loans of AMD 551.2 billion ($1.5 billion). Net profit for H1 2026 amounted to AMD 214.3 billion ($582.5 million), with its year-on-year growth slowing from 17% to 7%.
The volume of non-performing loans reached nearly AMD 505 billion (around $1.4 billion) by this date. Over the year, their share grew from 5% to 5.1% in the total loan portfolio, and from 3.3% to 3.6% in total assets. Furthermore, 57% of all toxic loans are concentrated in high-risk categories—doubtful and hopeless. The combined volume of these two categories grew by 49% year-on-year, primarily driven by an increase in the most toxic, loss-defined loans.
RANKING OF ARMENIAN BANKS AS OF 30.06.2026
(the ranking was compiled by the rating service specialists of ArmInfo news agency based on balance sheet reports/appendices published in the press and data provided by the banks)
USD thousand. The number in parentheses indicates the bank’s rank for that indicator.
|
Indicator
|
Ardshinbank*
|
Ameriabank
|
ACBA BANK
|
INECOBANK
|
IDBank
|
AMIO BANK
|
ARARATBANK
|
Converse Bank
|
EVOCABANK
|
Armeconombank
|
Bank VTB (Armenia)
|
ArmSwissbank
|
Unibank
|
Mellat Bank
|
Artsakhbank
|
FAST BANK
|
Byblos Bank Armenia
|
TOTAL
|
|---|---|---|---|---|---|---|---|---|---|---|---|---|---|---|---|---|---|---|
|
Total Capital
|
1 071 790 (1)
|
973 323 (2)
|
553 676 (3)
|
347 394 (5)
|
259 899 (8)
|
544 802 (4)
|
228 218 (12)
|
297 588 (6)
|
292 719 (7)
|
253 254 (10)
|
197 768 (13)
|
258 256 (9)
|
123 241 (15)
|
188 962 (14)
|
115 834 (16)
|
246 436 (11)
|
99 874 (17)
|
6 053 034
|
|
Charter Capital
|
543 641 (2)
|
148 798 (6)
|
254 388 (3)
|
148 268 (7)
|
152 328 (5)
|
571 080 (1)
|
53 359 (16)
|
54 394 (15)
|
62 519 (14)
|
106 937 (9)
|
173 710 (4)
|
44 051 (17)
|
102 217 (10)
|
87 254 (11)
|
63 229 (13)
|
138 903 (8)
|
72 049 (12)
|
2 777 124
|
|
Assets
|
7 792 717 (1)
|
7 181 714 (2)
|
3 089 301 (3)
|
2 765 355 (4)
|
1 457 629 (10)
|
2 588 145 (5)
|
1 206 166 (12)
|
1 707 813 (8)
|
2 069 011 (6)
|
1 799 978 (7)
|
798 803 (14)
|
1 300 095 (11)
|
1 138 730 (13)
|
343 466 (17)
|
495 964 (15)
|
1 504 591 (9)
|
375 251 (16)
|
37 614 730
|
|
Total Credit Investments
|
5 554 156 (2)
|
5 786 118 (1)
|
2 416 876 (3)
|
1 772 343 (5)
|
998 606 (10)
|
1 780 287 (4)
|
878 724 (11)
|
1 205 638 (9)
|
1 484 352 (6)
|
1 215 633 (8)
|
596 722 (14)
|
643 950 (13)
|
814 510 (12)
|
146 951 (16)
|
109 585 (17)
|
1 234 508 (7)
|
206 223 (15)
|
26 845 182
|
|
Mortgage Loans
|
941 309 (2)
|
1 188 517 (1)
|
278 699 (6)
|
261 987 (8)
|
155 374 (11)
|
363 653 (3)
|
108 417 (13)
|
300 397 (5)
|
340 109 (4)
|
179 004 (10)
|
88 456 (14)
|
111 640 (12)
|
260 519 (9)
|
44 177 (16)
|
14 942 (17)
|
276 837 (7)
|
85 959 (15)
|
4 999 996
|
|
Investments in Securities
|
824 996 (2)
|
940 264 (1)
|
207 273 (10)
|
540 434 (4)
|
147 141 (13)
|
696 626 (3)
|
154 937 (12)
|
270 947 (8)
|
250 474 (9)
|
279 684 (7)
|
83 578 (16)
|
458 952 (5)
|
72 027 (17)
|
168 608 (11)
|
338 702 (6)
|
104 637 (14)
|
102 944 (15)
|
5 642 221
|
|
Investments in Government Securities
|
789 587 (2)
|
886 281 (1)
|
199 913 (10)
|
356 317 (5)
|
95 475 (14)
|
695 845 (3)
|
109 512 (12)
|
244 124 (8)
|
231 959 (9)
|
278 574 (7)
|
83 513 (15)
|
432 217 (4)
|
57 769 (17)
|
168 556 (11)
|
338 558 (6)
|
101 062 (13)
|
73 924 (16)
|
5 143 185
|
|
Correspondent Accounts with Banks (Nostro)
|
574 256 (1)
|
120 998 (2)
|
32 298 (6)
|
16 718 (7)
|
48 302 (3)
|
41 267 (4)
|
7 952 (11)
|
14 851 (8)
|
40 522 (5)
|
5 586 (13)
|
11 116 (10)
|
12 365 (9)
|
7 369 (12)
|
4 687 (14)
|
191 (17)
|
3 656 (15)
|
2 529 (16)
|
944 664
|
|
Retained Earnings/Losses as of 01.01.26-30.06.26
|
186 945 (1)
|
108 693 (2)
|
44 955 (3)
|
37 080 (4)
|
27 593 (5)
|
25 664 (6)
|
24 437 (7)
|
23 864 (8)
|
21 837 (9)
|
16 427 (10)
|
14 513 (11)
|
13 011 (12)
|
12 182 (13)
|
10 352 (14)
|
7 713 (15)
|
5 440 (16)
|
1 828 (17)
|
582 533
|
|
Liabilities
|
6 720 927 (1)
|
6 208 391 (2)
|
2 535 625 (3)
|
2 417 961 (4)
|
1 197 730 (10)
|
2 043 342 (5)
|
977 948 (13)
|
1 410 225 (8)
|
1 776 292 (6)
|
1 546 724 (7)
|
601 035 (14)
|
1 041 839 (11)
|
1 015 489 (12)
|
154 504 (17)
|
380 130 (15)
|
1 258 155 (9)
|
275 377 (16)
|
31 561 695
|
|
Individual Deposits (demand and term)
|
2 730 925 (1)
|
2 146 229 (2)
|
1 111 962 (3)
|
1 028 214 (4)
|
427 445 (10)
|
989 602 (5)
|
403 592 (11)
|
585 034 (7)
|
817 285 (6)
|
401 231 (12)
|
351 966 (13)
|
110 065 (15)
|
527 059 (8)
|
10 157 (17)
|
107 085 (16)
|
526 041 (9)
|
140 141 (14)
|
12 414 031
|