


ArmInfo.Consumer loans dominate not only in volume, but also in toxicity
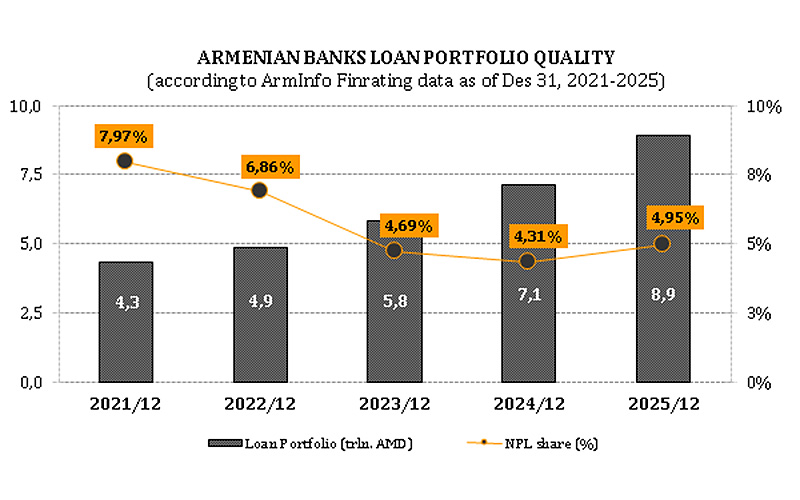
Consumer loans continue to dominate the loan portfolio – 40% (versus 42% a year ago), while also holding the lead in delinquency, increasing from 38% to 42% of the total volume of toxic loans over the year. Moreover, the standard group of consumer loans increased by 21% over the year, while the total volume of risky groups jumped by 45%, primarily due to a significant 61% increase in bad loans. Given this picture, it's easy to assume that newly issued loans largely represent refinancing of existing debt, which has historically proven the fragility of loan portfolio recovery, allowing toxic loans to be returned to the standard group only for a short period of time to salvage profits from write-offs.
The industrial sector ranks second in terms of delinquency, with its share increasing from 9% to 12% of the total volume of toxic loans over the year. Moreover, the 17% annual growth of the standard group was accompanied by a 79% increase in overdue loans, primarily due to a significant increase in medium- and high-risk groups (non-standard and dubious). Banks typically offer debt restructuring to entities in key economic sectors (industry, agriculture, construction), which entails reducing the financial burden, extending the repayment term, lowering the interest rate, or providing a temporary deferment.
The retail sector ranks third in terms of delinquency, with its share declining from 19% to 9% of the total volume of toxic loans over the year. Moreover, the 13% annual growth of the standard group was accompanied by a significant 41% reduction in overdue loans, particularly across almost all risk groups (except for bad loans), but especially the high-risk dubious group.
The construction sector ranks fourth in terms of delinquency, with its share declining from 10% to 7% of the total volume of toxic loans over the year. Moreover, the 24% annual growth of the standard group was accompanied by a modest 7% reduction in non-performing loans, driven primarily by a significant decline in bad loans and, in part, by a moderate reduction in low- and medium-risk groups (controlled and non-standard). This was paralleled by double-digit growth in the high-risk dubious group.
The food service/services sector ranks fifth in terms of delinquency, with its share declining from 8% to 6% of the total volume of toxic loans over the year. Moreover, the annual growth of the standard group by 8% was accompanied by a nearly identical reduction in overdue loans by 9%, in part due to a reduction in the volumes of the controlled and non-standard groups (the latter significantly). At the same time, there was a significant increase in the high-risk dubious group, and the bad group continued to expand.
The agricultural sector ranked sixth in terms of overdue loans, with its share declining from 5% to 4% of the total volume of toxic loans over the year. Moreover, the 21% annual growth of the standard group was accompanied by a reduction in non-performing loans of only 4%, in part due to a decline in the volumes of medium- and high-risk groups (non-standard, doubtful, and bad loans). This was paralleled by a significant increase in the low-risk controlled group.
Analysts note the sharp and impressive increase in non-performing loans to the financial sector, almost the entire volume of which accumulated over the year in the portfolio of a relatively new market entrant, Fast Bank, distributed primarily in the low-risk controlled group and the high-risk doubtful and bad loans. This bank's profits are showing the highest double-digit annual decline, indicating significant write-offs. Moreover, the bank's overall volume of delinquent loans increased by 83% year-on-year, reaching 14.6% of the loan portfolio (with the international critical limit being 10-15%). Fast Bank's bulk of delinquent loans are concentrated in consumer loans and, to some extent, in loans to the financial sector.
In mortgage loans, delinquent loans increased by 40% year-on-year, reaching 7% of the total volume of toxic loans (versus 6% the year before). Specifically, year-on-year growth across all risk groups increased, but bad loans saw a particularly significant increase, compared to a relatively modest 15% growth in standard loans. Notably, this trend in the mortgage market began to emerge after the abolition of the income tax refund mechanism, currently applicable to real estate in the capital (in the regions, this mechanism will be abolished starting in 2029, with the exception of border towns). The abolition of this mechanism weakened the annual growth of mortgage loans from 33% to 16%, and reduced their share of the total loan portfolio from 21% to 18.5%, and of the retail loan portfolio from 49% to 44%. ArmInfo Investment Company analysts once again emphasize: "In published financial reports under IFRS standards, the classification of the loan portfolio by risk group is 'blurred' and bad loans are excluded, which does not reveal the true picture of toxicity. To present the true quality of the loan portfolio in FinRating, ArmInfo Investment Company requests the necessary data from banks, a practice that has been in place since the format of published financial reports changed with the transition from national standards to IFRS." Incidentally, international rating agencies have repeatedly drawn the attention of financial authorities to this issue. Specifically, a recent mention by S&P Global Ratings in its February 2026 forecast report on the banking sector noted the likelihood of persistent discrepancies between problem loans reflected in national reporting standards (submitted monthly to the Central Bank) and loans reflected in quarterly financial statements published under international standards (IFRS). According to S&P Global Ratings, a high level of risk is reflected in economic stability, economic imbalances, and competitive dynamics, while a very high level of risk is reflected in credit risk in the economy, institutional framework, and banking system funding.
ArmInfo analysts clarify that the reports submitted by banks to the Central Bank are compiled according to national standards and do not conceal the true quality of the loan portfolio, unlike the published format, which complies with international standards, in which risk groups are not only grouped but also do not include the most toxic, non-performing group, thereby distorting the true picture of credit risk.
Trade retains its dominant share of GDP, but is no longer the leader in corporate loans.
Trade retains its dominant share of GDP, but is no longer the leader in corporate bank loans. In particular, among economic sectors, trade approached stagnation in the first half of 2026, with annual growth decelerating from 3.9% to 0.9%. Meanwhile, credit debt continued to grow at a double-digit rate, with an imperceptible slowdown in annual growth from 13% to 11%. Moreover, judging by the quality of loans in this sector, high-risk groups—doubtful and bad—continue to dominate overdue loans. A significant reduction in the former, along with a decrease in the volume of low- and medium-risk groups (controlled and non-standard), is most likely the result of formal portfolio recovery through restructuring or refinancing of accumulated debt. However, some toxic loans still joined the bad group. Thus, the share of the riskiest groups—doubtful and bad—in the volume of overdue loans in the trade sector continues to exceed 85%. However, the share of overdue loans in the total volume of loans to the trade sector decreased from 8.6% to 4.5%.
Among economic sectors, trade, as a result of the anticipated formal recovery of its toxic portfolio, yielded its lead in terms of overdue loans in the first half of 2026 to the industrial sector, while also losing its lead in terms of outstanding loans to the construction sector. Meanwhile, construction is the main driver of GDP growth (accelerating from 18.5% to 24.5%), while the industrial sector has only recently improved its performance (from a 12.1% decline to 10.8% growth).
Mortgage growth slowed amid a recovery in real estate prices
Mortgage loans significantly slowed in their annual growth rate from 33% to 16%, amounting to 1.8 trillion drams (almost $5 billion) by July 1, 2026. According to cadastral data for the second quarter of this year, 3,519 mortgage transactions were concluded (or 6,551 in the first half of the year), of which 1,959, or 55.7%, were for real estate in the capital (or 3,899 in the first half of the year). However, the growth of the latter was negligible compared to the growth rate of similar transactions in the regions – 1% versus 22-82%, and Kotayk, Ararat, Armavir, Syunik, Shirak, and Aragatsotn were distinguished by high activity. The largest number of mortgage transactions were concluded for the purchase of apartments - 2,509 or 71.3%, much less for the purchase of private houses - 767 or 21.8%, and even fewer for the purchase of land - 109 or 3.1%. At the same time, there was a 16.9% annual price increase (June 2026 vs. June 2025) for apartments in Yerevan and a 14.5% increase for apartments in the regions.
This high demand for regional real estate is explained by the abolition of the income tax refund mechanism for mortgage loans for real estate in Yerevan, which had been in effect for ten years (since 2014) starting in 2025. However, this mechanism continues to apply in the regions and is scheduled for complete abolition starting in 2029, with the exception of border settlements.
At the same time, there was a 16.9% annual price increase (June 2026 vs. June 2025) for apartments in Yerevan and a 14.5% increase for apartments in the regions. According to the Central Bank, the Armenian real estate market began to see a recovery in sales price growth in the second quarter of 2026, following a slowdown over the past year and a half, leading to a sideways trend. However, the Central Bank was unable to assess the extent to which this is due to the simplification of real estate acquisition processes, given that non-residents are also purchasing apartments with mortgages. According to the Central Bank's data, the observed macro-level price growth in the real estate market is considered to be definitely normal.
The Central Bank noted that real estate price growth has only just begun, and it is difficult to predict its potential level, especially given its dependence on external factors. The Central Bank does not rule out the possibility of a scenario in which, driven by high demand from several tens of thousands of people in Armenia's small market, prices could come under significant pressure. However, these are manageable risks in terms of both financial stability and inflation. The Central Bank noted: "While previously real estate prices were rising in the regions and remained relatively stable in Yerevan, now we can see a recovery in growth in the capital as well. "The impact of relocators and our compatriots transferring their capital here is definitely there."
Time deposits have consolidated their status as the main source of funding for active operations
In funding Armenian banks' active operations, time deposits, after two years of outweighing demand deposits (starting in 2022 due to large-scale financial transactions by relocators), regained their status as the main source in the first quarter of 2025, further increasing their dominance to 36% of total liabilities by July 2026, slightly falling behind the 38% recorded in 2021, but significantly behind the historical maximum of 48% in 2017. At the same time, the share of demand liabilities in total liabilities remained at 34%, significantly exceeding the 26% recorded in 2021.
However, a slowdown in the annual growth of term deposits from 25% to 23% and an acceleration in the growth of demand liabilities from 8% to 20% are becoming visible. The absolute values of these liabilities reached 4.2 trillion and 3.9 trillion drams (or $11.3 billion and $10.7 billion), respectively, by July 2026. Moreover, legal entities' funds grew more significantly in term deposits (by 31%), while individual funds demonstrated a strong increase in demand liabilities (by 29%). This is despite the fact that individual funds dominate term deposits, while demand liabilities are dominated by Legal entities' funds, with the former growing more significantly year-on-year than the latter – 21% versus 16%.
Overall, individual deposits (time and demand) slowed slightly in year-on-year growth from 13% to 22%, exceeding $12.4 billion, of which 61%, or $7.6 billion, were represented by time deposits and 39%, or $4.8 billion, by demand deposits. As a result of the more significant growth in individual demand deposits (29%) than in individual time deposits (21%), the gap in the absolute values of these indicators remained unchanged over the year – The latter continued to dominate the former by 1.6 times. At the same time, funds raised from external sources slowed in year-on-year growth from 33% to 10%, exceeding $6 billion. This reduced their share of total liabilities from 21% to 19%, again moving away from the record 25% (in 2020-2021).
As a result, total liabilities quietly accelerated in year-on-year growth from 19.5% to 20.3%, reaching $31.6 billion.
In total capital, authorized capital and profit almost equaled the loss in growth rates.
The total capital of Armenian banks slowed in year-on-year growth from 19% to 14%, amounting to $6.1 billion. In its structure, the share of authorized capital decreased over the year - from 49.3% to 45.9% ($2.8 billion), while accumulated profit, on the contrary, increased from 43% to 45.1% ($2.7 billion). Moreover, a strong slowdown in annual growth was noted for the authorized capital - from 17% to 6%, and not so noticeable for accumulated profit - from 21% to 19% (taking into account the weakened growth of net profit). In particular, only a few banks (4 out of 17 operating) replenished their authorized capital on an annual basis - these are AMIO Bank (by 10.5% - in the first quarter of 2026), IDBank (by 43.7% - in the third quarter of 2025), Fast Bank (by 10.9% - in the second quarter of 2026), Inecobank (by 14.01% in the fourth quarter of 2025). At the same time, one bank recorded a reduction in its authorized capital: Unibank (by 3.8% in Q2 2026).
Against the backdrop of accelerating double-digit growth in risk-weighted assets from 18% to 24%, the adequacy ratio of both total capital increased slightly, from 27.02% to 28.62% on average across the market (N1 with a minimum of 11%), and core capital increased slightly, from 24.5% to 25.31% (N1/1 with a minimum of 6.2%).
The top five banks remain unchanged.
By volume of credit investments (including interbank loans and deposits) and funds raised (including liabilities to clients, loans from external sources, and funds received from the placement of own bonds), the TOP-5 Ameriabank, Ardshinbank, Acba Bank, AMIO Bank, and Inecobank represent the top five banks in terms of externally attracted loans, accounting for 65% and 64% of the market, respectively.
Four of these banks are among the top five in terms of funds raised from external sources: Ameriabank, Ardshinbank, Acba Bank, and Inecobank, with a total market share of 59%. Ardshinbank, Ameriabank, ArmSwissBank, Acba Bank, and Inecobank represent the top five banks in terms of funds raised from their own bond issues, accounting for a total market share of 74%.
In terms of term deposits, the aforementioned five banks represent the top five: Ameriabank, Ardshinbank, Acba Bank, AMIO Bank, and Inecobank, with a total market share of 59%. Of these, four also lead in demand deposits—Ardshinbank, Ameriabank, Acba Bank, and Inecobank—with a combined market penetration of 66%. All five of these banks are in the top 5 for corporate loans, with a combined market penetration of 71%. Four of them are among the top five for retail loans, with a combined market penetration of 51%, with Ameriabank leading the list in both cases. In terms of interbank loans/deposits placed, Ardshinbank holds the lead with a 31% market share, but Ameriabank leads in purely interbank loans with a 21% market share.
The above-mentioned five banks also established themselves as leaders in terms of assets and total liabilities (with a market share of over 62-63%), as well as total capital (with a market share of approximately 58%), with the top two banks – Ardshinbank and Ameriabank – holding the dominant share (34-41%).
These five banks completed the first half of 2026 with a profit, but four of them – Ardshinbank, Ameriabank, Acba Bank, and Inecobank – remained in the top 5, accounting for approximately 65% of the total net profit in the banking sector, with almost 51% The first two generates.