

ArmInfo. Inflation of 4.4% was recorded in the Armenian consumer market in August 2026 compared to August 2025 (against the inflation rate of 3.6% a year ago), mainly caused by the rise in food prices. For the first 8 months of 2026, inflation amounted to 1.9% (against last year's inflation of 0.8% in the same period), which was largely due to the continuing rise in prices for services and partly due to the increase in food prices. According to the Statistical Committee of the Republic of Armenia, in August of this year alone, Inflation was recorded at 0.2% (the same as the same month a year earlier), driven by a more noticeable increase in service prices of 1.3% (compared to 0.3% a year ago) and continued growth in non-food prices of 0.4%, with a seasonal decline in food prices of 0.8% (compared to unchanged prices in August 2025).
Over the first 8 months of this year, Inflation was primarily driven by the continued rise in service prices by 2.7% and rising prices for food and non-food items by 1.6% and 1.2%, respectively. This compares to lower inflation recorded over the eight months of the previous year, driven by a 0.2-0.4% decline in food and non-food prices and a more significant 2.9% increase in service prices.
Inflation was 4.5% in January-August 2026, compared to the same period in 2025, compared to 3.2% in the previous year. Moreover, food prices increased by 7.4%, services prices increased by 2.6%, and non-food prices increased by 1.7%. This compares to a year earlier when food prices increased by 5.1%, services prices increased by 3%, and non-food prices decreased by 0.4%. [p>
In August 2026 compared to August 2025, inflation of 4.4% resulted from a more noticeable increase in food prices by 6.6%, which accelerated to 2.4% in non-food prices, while service tariffs increased by 2.8%. A year earlier, in August 2025 compared to August 2024, inflation was lower at 3.6%, driven by a 5% increase in food prices and a 3.2% increase in services, with a less noticeable increase in prices. Non-food products by 1.1%.
Of the food products, the most significant price increases year-on-year (August 2026 vs. August 2025) were: eggs - by 27.4%, beef - by 22.6%, cocoa - by 18.2%, lamb - by 15.5%, spelt (dzavar) - by 12.6%, fruit - by 10.5%, buckwheat - by 10.1%, sour cream and sunflower oil - by 8.8%, milk - by 8.1%, cheeses and cottage cheese - by 7.2%, pasta - by 6.8%, chocolate - by 6.3%, tea and coffee - by 5.9-5.4%, poultry - by 3.3%, flour - by 3.1%. Prices for granulated sugar increased much more modestly - by 2.3%, bread - by 1.9%, peas - by 1.6%, vegetables - by only 0.4%, and pork - by 0.1%. Among food products, trout fell in price - by 12.7%, rice - by 4.7%, beans and lentils - by 4.5-3.2%, and butter - by 2%.
Of fruit, prices increased significantly year-on-year: apricots - by 41.5%, grapes - by 34.2%, tangerines - by 22.7%, peaches - by 21%, bananas - by 18.1%, apples - by 15.4%. Only oranges and strawberries fell in price - by 14% and 6.6%, respectively. Of the vegetables, the most significant price increases were for cabbage (up 50.2%), greens (up 27.3%), eggplant (up 21%), and green beans (up 14.1%). Only cucumbers, carrots, garlic, potatoes, and tomatoes saw price decreases, falling by 19.1%, 17.3%, 13.7%, 12.5%, and 2.7%, respectively.
Cigarette prices increased by 7% year-on-year, compared to an 8.2% increase the year before. Among alcoholic beverages, vodka saw the most significant year-on-year increase, up 11%, while beer and wine saw more modest increases, up 4.2% and 0.9%, respectively. Last year, beer and wine saw similar increases, at 2.4% and 2.9%, respectively, while vodka saw a less pronounced increase, at 4.8%. Bottled mineral water prices increased by 3.5% year-on-year (versus a 2.8% increase a year ago). In the non-food market, the annual price growth accelerated for jewelry — from 23.7% to 25.3%, for furniture — from 0.2% to 1.1%, for footwear — from 1.3% to 3%, for disposable household goods — from 4% to 5%. Clothing prices began to rise — by 3.8% (versus a 0.6% decrease a year ago). The annual price growth for medical equipment slowed — from 5.4% to 1.5%, for large and small household electrical appliances — from 4.1-5.9% to 0.4-0.9%. At the same time, the annual decline in prices for gardening tools accelerated — from 8.8% to 12.6%. Medicines fell in price by 0.1% (compared to a 4.4% increase last year), and tableware and kitchenware fell by 0.9% (compared to a 0.2% increase last year).
Gasoline and diesel fuel prices increased year-on-year (August 2026 vs. August 2025) by 11.7% and 25%, respectively, compared to a 2.9% and 2.4% decline last year for gasoline and diesel fuel. Liquid hydrocarbons (butane, propane, etc.) increased in price by 23.6% annually.
As for services, a significant annual increase in rates was recorded for compulsory motor third-party liability insurance – by 14% (versus 6.6% a year ago), and rates for hotel services accelerated – from 2.7% to 6.6%. Medical services increased in price more significantly than a year ago – by 5.3-7.1% (versus 2.3-3.2% a year earlier), and doctor consultations – by 9.3% (versus 7.1% a year ago), while dental services continued to increase more modestly – by 2.2% (versus 5.3% a year ago). Tariffs for comprehensive leisure services slowed significantly, from 14.3% to 7.2%, as did hairdressing and spa services, from 11.5% to 3.7%.
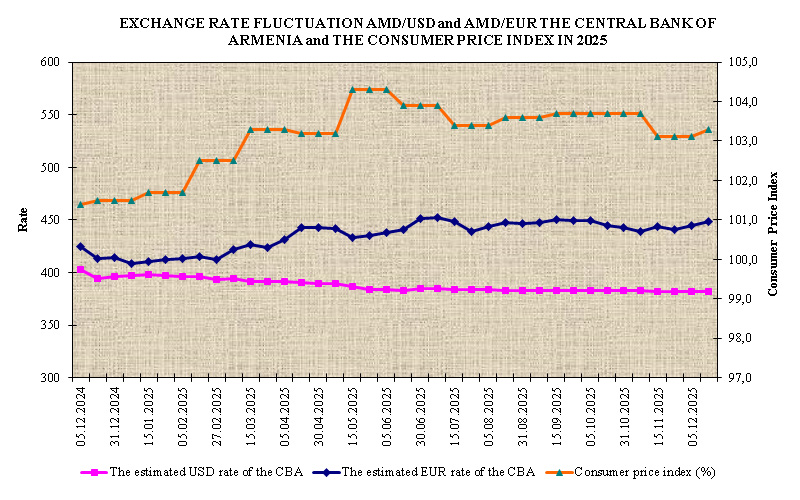
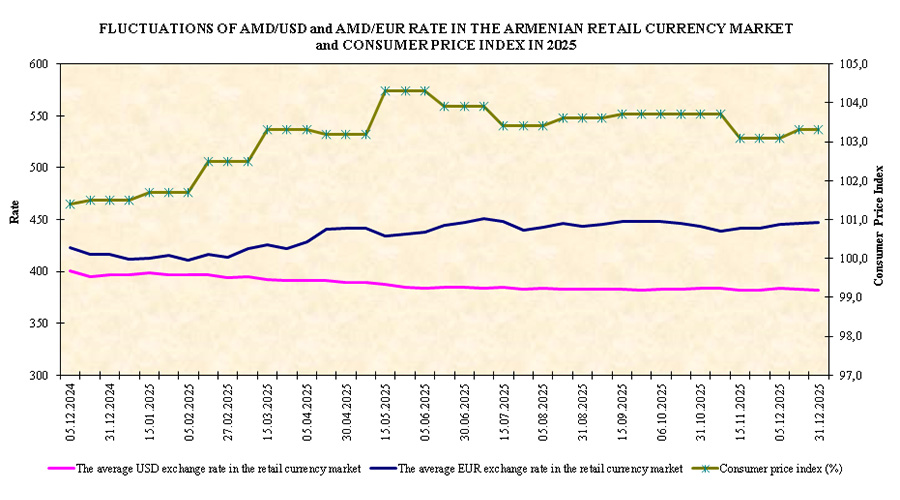
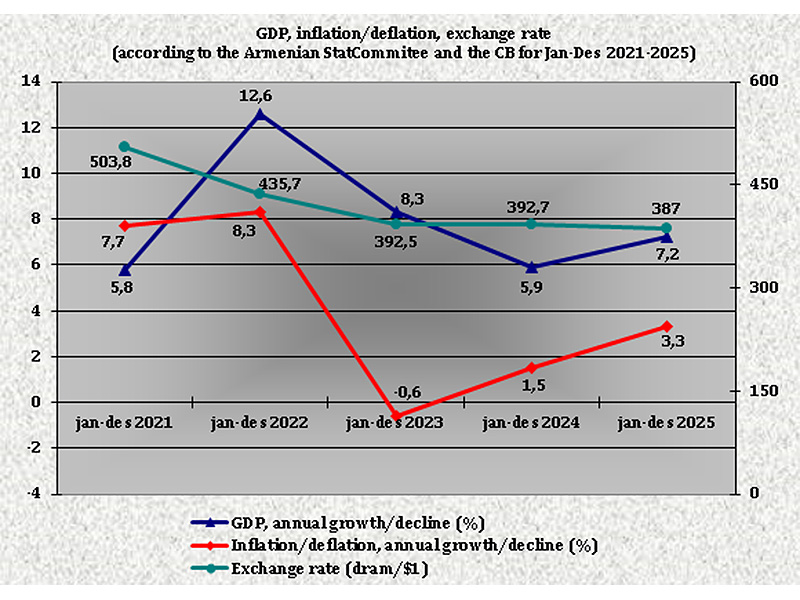
August's annual inflation of 0.2% was accompanied by a 0.4% appreciation of the dram against the dollar, which was also observed the previous year—inflation of 0.2% and a 0.2% appreciation of the dram against the dollar. Specifically, the dram strengthened in August 2026 to 365.5 drams per dollar, from 383.2 drams per dollar in August 2025.
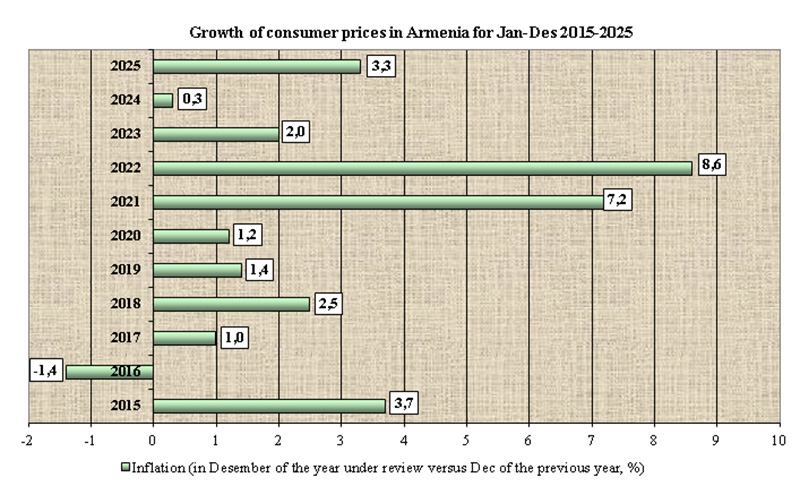
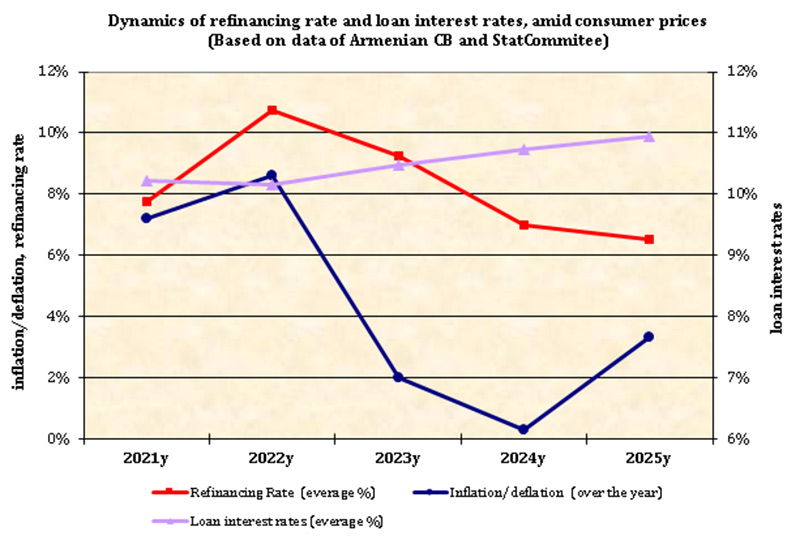
It should be noted that starting in 2025, the inflation target is set at 3% with an acceptable range of +/- 1 percentage point. (versus the previous 4%, +/- 1.5 percentage points).