

ArmInfo. In Armenia, economic activity growth in January- December 2024 slowed down to 8% per annum (from 9.4% in 2023 and 14.2% in 2022), but the export and import trends did not change significantly. This is evidenced by the final data from the RA Statistical Committee.
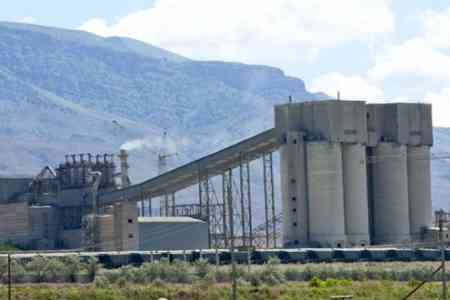
Judging by the information in the final statistical report, it is important to note that the high growth of exports and imports is still driven by a significant increase (2.5-2.7 times, compared to 3.2-3.3 times a year ago) in the volume of trade in precious metals and stones. The share of these commodities in foreign trade rose from 27% to 51% over the year. This growth occurred despite a sharp decline in the jewelry industry, which saw a 32.2% decrease compared to a 4.9-fold increase a year ago. The industrial sector continues to grow, primarily due to basic metals, coke and oil refining products, the metallurgical industry, electrical equipment, and the woodworking industry.
Moreover, it is worth noting that in the statistical report on the industrial sector, the e production of coke and liquefied petroleum products was reported in June 2023 at 29.5 million drams, which remained until the end of the year, followed by significant growth 2024. By the end of the first half of the year, the production had already reached an impressive rate of 614.3 million drams. This trend continued through the end of 2024, recording a 24.6-fold increase in the production of coke and liquefied petroleum products, totaling 743.1 million drams. However, this figure is still modest in comparison with other segments of the industrial sector. The leaders in the industrial sector in terms of volume are the food industry (701.8 billion drams, with an annual growth of 5.6%) and the production of basic metals (455.6 billion drams, with an annual growth of 38.4%).
According to the final statistics, the slowdown in annual growth of economic activity in January-December 2024 came largely from the trade sector - from 25.7% to 17%, and to a slightly lesser extent from the construction sector - from 14.8% to 14.5%. However, there was a slight acceleration in the growth of the services sector - from 10.3% to 10.6% and the industrial sector from 4.1% to 4.7%. Along with this, the annual dynamics of the agricultural sector improved, transitioning from a 0.3% decline to 1.6% growth. The energy complex recorded annual growth of 6.5%, although the previous year's dynamics are not indicated in the statistical report due to a change in the calculation methodology from 2023. In terms of volume for January-December 2024, the trade sector leads with a volume of 6.4 trillion AMD ($16.2 billion). The service sector comes in second with 3.5 trillion AMD ($8.8 billion), followed by the industrial sector - 2.99 trillion ($7.6 billion), the fourth place is the agricultural sector - 958.8 billion ($2.4 billion), and the fifth place is the construction sector - 709.5 billion AMD ($1.8 billion). The volume of electricity generation in January-December 2024 amounted to 9381.4 million kWh, of which only in December - 926.4 million kWh. A more significant slowdown in economic activity growth is observed in December 2024 compared to December 2023 dropping from 9.5% to 4.7%, and in December alone the dynamics reversed from a 1% decline towards 22.7% growth compared to a growth acceleration in November 2023 from 0.6% to 19.8%).
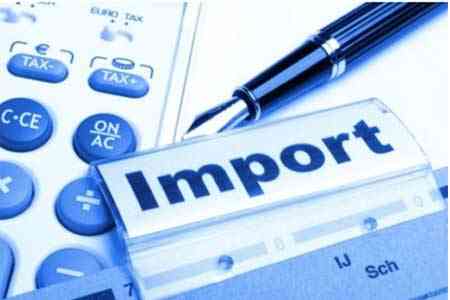
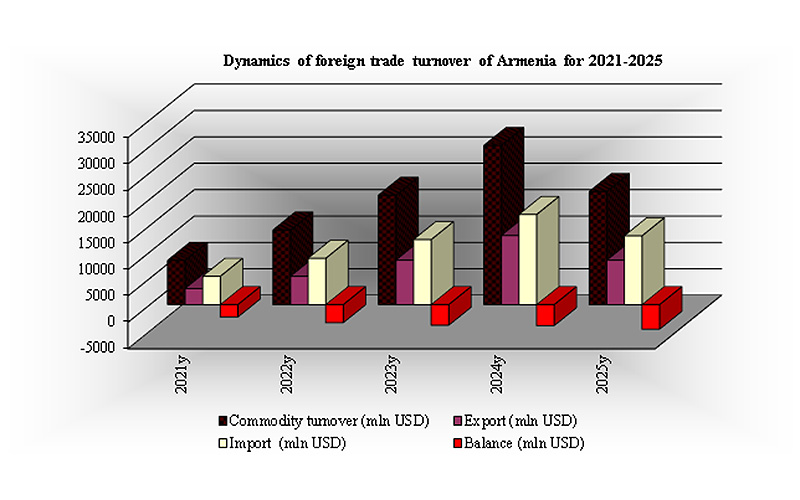
Moreover, such a slowdown in economic activity growth in December 2024 compared to December 2023 was largely due to the deterioration of the industrial sector dynamics, shifting from a 20% growth to a 14.8% decline, a strong slowdown in the growth of the trade sector from 35.9% to 10.3%, with a slight increase in the construction sector from 11.5% to 12.9%, a notable acceleration of growth in the services sector from 3.4% to 19.4%, and growth in the energy complex by 12.8%. Against this backdrop, Armenia's foreign trade turnover in January-December 2024 reached 11.9 trillion drams ($30.2 billion), showing a slight slowdown in annual growth to 41.5% (from 46% in 2023). This is due to the same imperceptible slowdown in annual growth of both imports - from 40.2% to 33.8%, and exports - from 55.3% to 53.1%, the absolute value of which amounted to 6.7 trillion and 5.2 trillion drams ($17.1 billion and $13.1 billion), respectively. At the same time, a more significant decline in the dynamics of foreign trade turnover is noted in December 2024 compared to December 2023 - from 72% growth towards 37.3% decline, which is due to a reversal in the trend of both exports and imports towards a decline of 48.6% and 26.5%, respectively (from growth of 2.4 times and 33.2% in 2023).
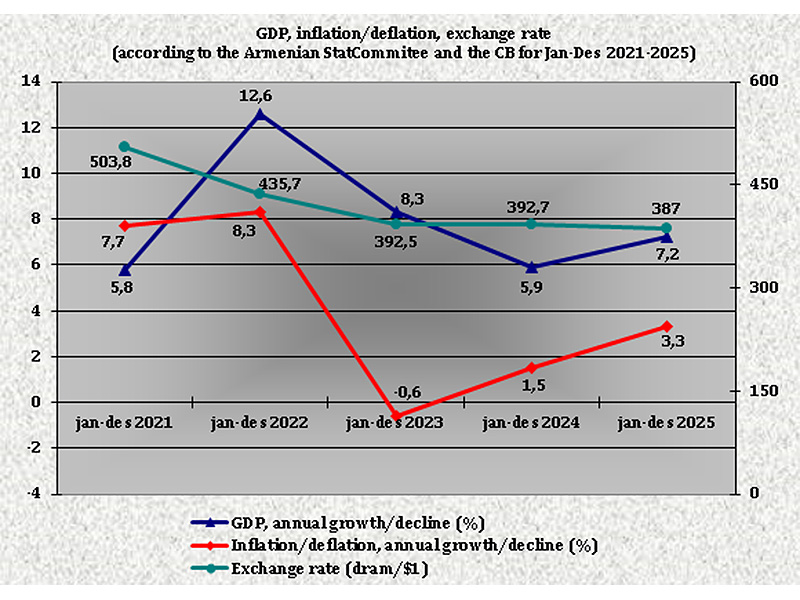
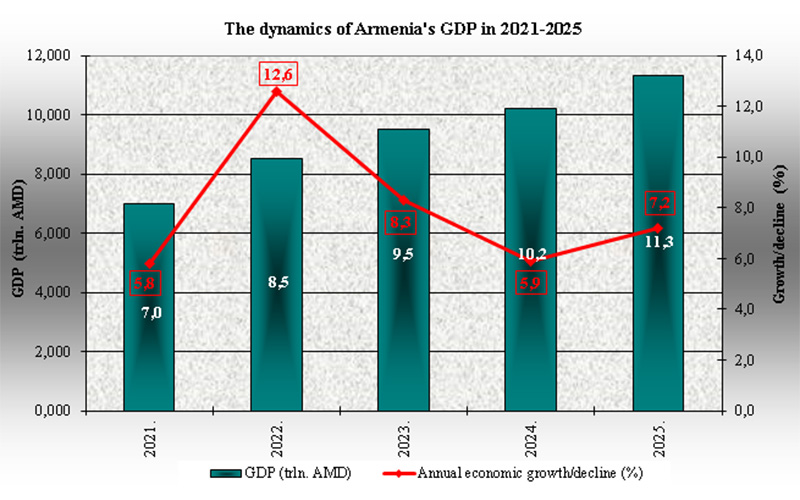
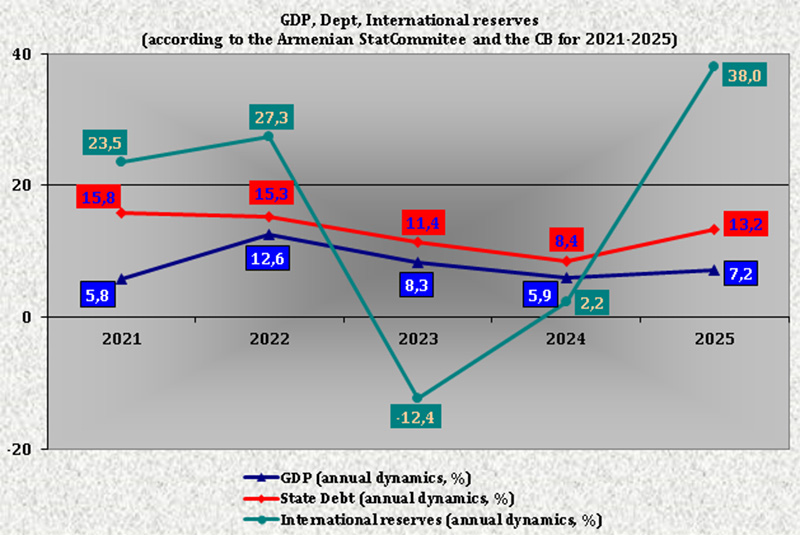
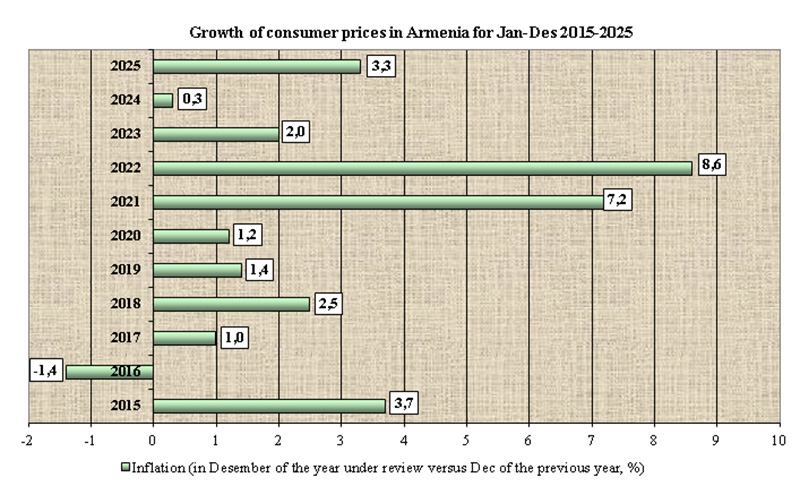
It should be noted that according to the December forecast of the Central Bank, Armenia's GDP growth in 2024 was expected to be 6% (compared to the actual 8.3% in 2023), with a further acceleration in 2025 to 7.1% or a slowdown to 4.8%, depending on the inflation trajectory. According to the Central Bank's forecast, foreign trade growth in 2024 was expected to decrease to 26.5-28.3% (for exports) and 27.8- 25.7% (for imports), with a reversal in dynamics in 2025 towards a double-digit decline in both exports by 25.3-16.3% and imports by 13.9-20.7%. In its November forecast report, the IMF indicated that Armenia's GDP growth would be 6% in 2024, with a further slowdown in 2025 to 4.9%. In its November forecast report, the World Bank indicated more modest rates of Armenia's GDP growth: 5.5% in 2024 and 5% in 2025. The draft budget of Armenia for 2024 included a 7% GDP growth, while the draft budget for 2025 has a lower target of 5.6%.
Recall that since 2023, there has been a change in the methodology for calculating the volume of generated electricity in statistical reports. Specifically, the volume of electricity generated by autonomous producers is also taken into account. As a result, due to incomparability with the 2022 indicators, the annual dynamics of the energy complex are absent from the 2023 statistical reports. Data on the agricultural sector are only published in quarterly and annual statistical reports. (The average calculated exchange rate of the dram in January-December 2024 was AMD 392.73 / $ 1).