

ArmInfo.Transactions with precious metals and stones have been declining in Armenia's foreign trade since 2025, accounting for 23% of the total ($3 billion) in the first eight months of the year, down from 57% ($12.6 billion) a year ago. This category of goods played a decisive role in the deterioration of the country's annual foreign trade turnover, which plummeted from a significant 79.6% growth to a significant 41.1% decline.
According to the Statistical Committee of the Republic of Armenia, in January-August 2025, the share of imports and exports of precious metals and stones in total trade fell to 18% and 32%, respectively, compared to 50% and 66% in the same period last year. In terms of volume, $1.4 billion worth of these products were imported and $1.6 billion worth were exported during the reporting period: imports fell by 77.5% and exports by 75.8% year-on-year.
By comparison, we note that a sharp increase in this item, which became a dominant component of Armenia's foreign trade, began to be observed in 2022, accelerating even more significantly over the following two years. Specifically, in 2022, $989.3 million worth of precious metals/stones and products made from them were exported (a threefold increase year-on-year), while $690.8 million were imported (a 2.8-fold increase year-on-year).
In 2023, the significant growth in exports and imports of precious metals/stones and precious metal products not only continued but also accelerated to 3.2-3.3 times, reaching export volumes of $3.2 billion and imports of $2.7 billion. This trend continued in 2024, and despite a slight slowdown in growth, the growth rate remained impressive (2.5-2.7 times), further increasing export and import volumes to $8 billion and $7.4 billion, respectively.
However, starting in 2025, transaction volumes involving precious metals/stones began to decline, and at a significant rate, worsening the annual dynamics of export and import volumes from impressive growth to a significant decline (from a 7-fold increase in January-August 2024 to a 75.8-77.5% decline in January- August 2025).
Meanwhile, production volumes in the jewelry industry continue to look quite modest: 42 billion drams for 2022 (a 51.8% increase), 230.9 billion drams for 2023 (a 4.9-fold increase), and 53.2 billion drams or $135.4 million for 2024 (a 32.2% decline). The downward trend has continued in 2025, as evidenced by a 60.9% annual decline in January-August (to 17.9 billion drams or $46 million). A year ago, a significant slowdown in growth was already evident, from 82.6% to 16.6%, with a volume of 40.6 billion drams ($103 million).
According to experts, the very fact that precious metals and stones began to significantly dominate exports and imports three years ago, while production volumes in the jewelry industry remained low, already indicated a sharp increase in re-exports and re-imports, which, judging by data for 2024, were still taking place.
However, starting in 2025, such transactions at the previous volume became impossible due to the settlement of customs duties on jewelry within the EAEU. Since 2020, Russia has submitted a proposal to the Eurasian Economic Commission (EEC) more than three times to zero out the import customs value of colored gemstones and fine-cut diamonds up to 0.2 carats. However, the issue remained unresolved, as Armenia blocked the zeroing of duties. Due to the import customs duty on precious stones, importing finished jewelry from third countries outside the EAEU was much more profitable than manufacturing it within the union. The import duty rate on finished jewelry is lower than the rates (10-15%) for precious stones used for manufacturing. However, starting in 2025, this "high-yield" effect was lost. Russia zeroed out duties on jewelry imports from the UAE.
The actual volumes of re-export and re-import of precious metals and stones are evidenced by Armenia's customs data for 2024, according to which diamonds and gold imported primarily from Russia (73% and 99.4%, respectively) were exported primarily to the UAE (74.8% diamonds and 70.2% gold) and Hong Kong (16.4% diamonds and 20.2% gold). A nearly identical picture emerged based on the results of 2023, but then 46.7% of diamonds and 99.2% of gold came from Russia, which were also exported to the UAE (84.6% diamonds and 71.4% gold) and Hong Kong (2.7% diamonds and 25.4% gold). Customs data is usually published semi-annually and annually, and, judging by the speed of their preparation, will be posted on the agency's website 6-7 months after the reporting period, i.e. For the first half of 2025, at best, data will appear in December, and for the entire 2025, in August 2026.
According to statistics, despite the significant decline in transactions with precious metals and stones, this item still maintains its leadership in exports, while in imports it has slipped to second place, giving way to the item "machinery, equipment, and mechanisms." It's worth noting that the traditionally dominant export and import items-mineral products and finished foodstuffs-having lost ground to precious metals, machinery, equipment, and mechanisms, have yet to regain their leading positions in foreign trade. However, the duration of the decline in transactions with precious metals and stones suggests that mineral products and finished foodstuffs will regain their positions in the short term.
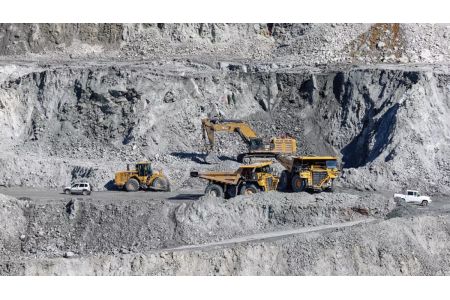
In particular, in terms of mineral product exports and imports, after a slowdown in growth in 2022 and a decline of 13.6-6.9% in 2023, both exports (by 15.1%) and imports (by 0.3%) were able to return to growth in 2024. Subsequently, in January-August 2025, imports increased by 3.7%, while exports increased by 4.4%, reaching $739.9 million and $715.4 million, respectively. Compared to the same period last year, this indicates an improvement in the import trend (up from a 3.9% decline) and a slowdown in export growth (from 15.5%). This has pushed mineral products into fourth place in exports (now behind not only precious metals and stones, but also machinery/equipment and finished food products). In terms of imports, mineral products were in 3rd place, slightly ahead of the item "land, air and water transport" in volume, but significantly behind the leading item "machinery, equipment and mechanisms" and "precious metals and stones", which fell to 2nd place.
Machinery, equipment, and machinery exports reached $830.3 million in January-August 2025, while imports totaled $1.7 billion. The year-on-year trend of these indicators is downward: exports slightly accelerated from 0.6% to 1.7%, while imports stagnated (compared to 2.8% growth a year ago). Machinery, equipment, and machinery took the lead in imports, as previously leading precious metals and stones experienced a significant decline in volume. Machinery, equipment, and machinery remained in second place in exports, gradually losing ground to the currently leading precious metals and stones.
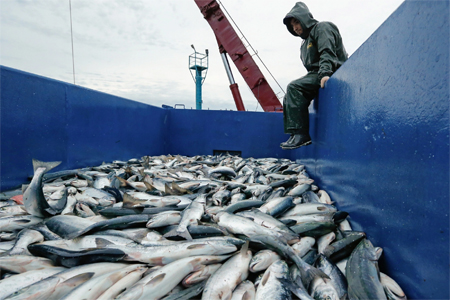
Exports and imports of finished food products improved year-on-year, showing strong double-digit growth of 28.8% and 22%, respectively, compared to a meager 0.1% increase in exports and a relatively moderate 12.9% increase in imports a year ago. The volume of finished food exports in January-August 2025 reached $755.4 million (3rd place), while imports reached $535.6 million (5th place).
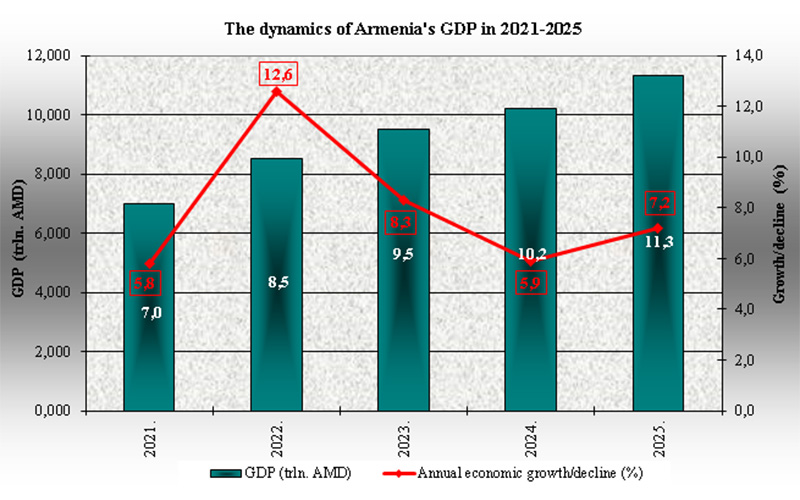
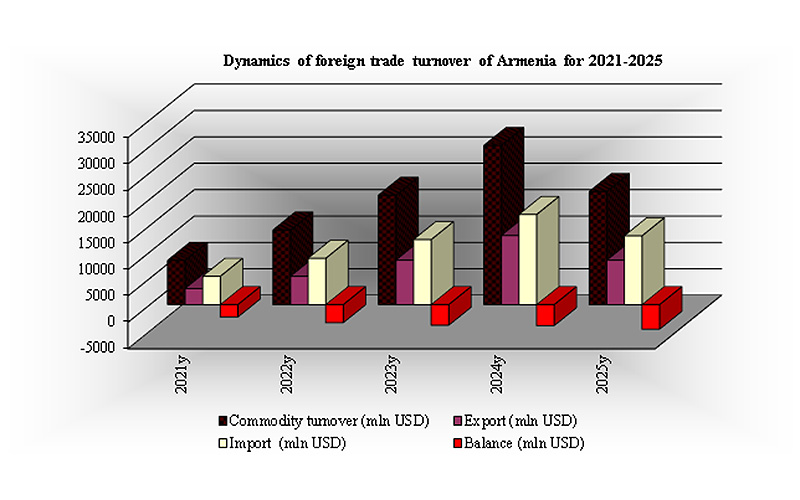
Overall, exports for January-August 2025 reached $5 billion, with a reversal in year-on-year growth from 2.1 times to a 48.8% decline. Imports exceeded $7.9 billion, also declining from 59.3% growth to 34.9%. As a result, foreign trade turnover fell by 41.1% year-on-year (compared to 79.6% growth a year ago), amounting to $12.9 billion in January-August 2025.
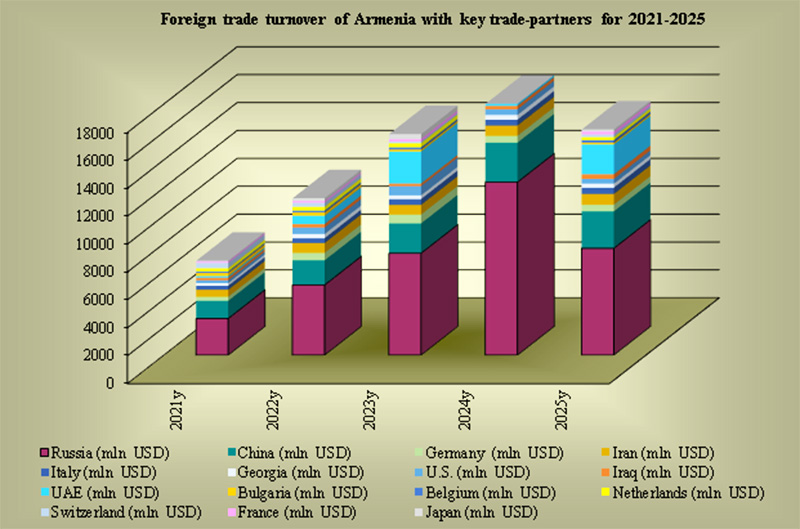
Moreover, when broken down by country, a significant deterioration in the annual dynamics of foreign trade turnover was recorded for the leading countries: Russia (from a 2.1-fold increase to a 51.3% decline), the UAE (from a 6.8-fold increase to a 69.9% decline), and China (from a 37.7% increase to an 11% decline). Specifically, both imports (by 63.3%) and exports (by 7.9%) fell to Russia. To the UAE, a 70.8% decline in exports was accompanied by an 18.9% increase in imports. To China, a 48.7% decline in exports was accompanied by a 19.9% increase in imports.
It is noteworthy that foreign trade turnover between Armenia and the EU grew by 5.6% (from a 19.2% decline a year ago), reaching $1.6 billion in January-August 2025. This was due to an improvement in the annual dynamics of imports, from a 17.2% decline to 7.6% growth, and a significant slowdown in the decline in exports, from 24.2% to 0.2%, with export volumes amounting to $1.2 billion and $390.6 million, respectively. The EU's share of total foreign trade increased over the year from 6.8% to 12.2%, in particular in exports - from 4% to 7.8% and in imports - from 9.1% to 15%.
Meanwhile, foreign trade turnover between Armenia and the EAEU deteriorated year-on-year, from a two- fold increase to a 49.9% decline, amounting to $4.7 billion in January-August 2025. This was the result of a significant 62.7% decline in imports (compared to a 3.6-fold increase a year earlier) and a lingering decline in exports, with a slowdown from 18.4% to 5.9%, amounting to $2.7 billion and $2 billion, respectively. The EAEU's share of total foreign trade declined year-on-year from 42.9% to 36.5%, with a decline in import share from 59.9% to 34.3% accompanied by an increase in export share from 21.8% to 40.1%.
It should be noted that the Central Bank of Armenia, in its September updated forecast, predicted that after almost equal growth of exports and imports in 2024 by 35.6-31.4%, in 2025 exports will decrease by 30.4- 36.8% and imports by 32.1-32.7%, with growth in 2026 of exports by 2.7-4.4% and imports by 3.1-3.4%. The IMF, in its April forecast for 2025, predicted a more modest decline in Armenia's foreign trade: exports by 10.4% and imports by 5.4%. The World Bank has not yet updated its forecast for Armenia's foreign trade for 2025, but in early November it voiced expectations of a sharp slowdown in growth of both exports to 5.6% and imports to 7%.