

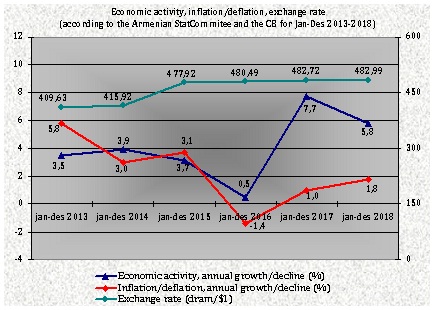
ArmInfo. The economic activity in Armenia during January-April - 2017 grew for 5,7% per annum within the 16,1% growth of export and 14,6% growth of import. In April this year, versus April 2016 the economic activity grew for 3,4%, and only for April 2017 - for 0,3%. A year ago, in January-April 2016 and for the same period of 2015 the economic activity grew for 6%, in
April this year versus April 2015 - for 6,8%, and only for April - for 4%. For a comparison it could be mentioned that in 2015 the economic activity for January-April increased for 2,7% per annum, and only for April - for 3,4% ( within annual growth for 3,2%).
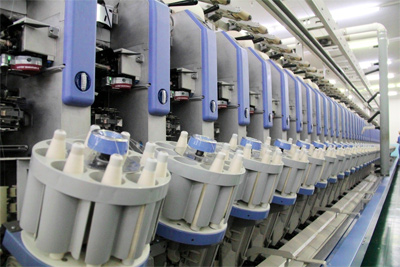
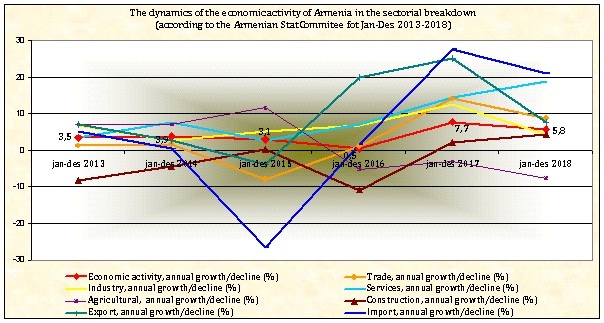
According to preliminary data of RA National statistics service , the economic actiuvity growth for January-April 2017 was mostly preconditioned by industrial sector - for 12,9% per annum, trade sector - for 12,1%, services sector - 10,1 % per annum, within which the energy complex growth speed were more than simple -4,45 At that, the annual volumes decrease was observed at agricultural sector - for 2,9%, and construction sector - for 13,4%. A year ago, in January-April 2016, the industrial sector, services, agricultural sector and energy complex were in growth - with 10-9,3-4,1-3,5% respectively, and the trade sector and construction sector showed dropdown - accordingly for 0,8% and 7,4%. The industrial products index grew in January-April of 2017 for the similar period of 2016 for 3,3%, in Arpril 2017 versus April 2016 - for 3%, and only for April 2017 decreased for 0,6%. A year ago, for January-Arpil 2016 in comparison to the similar period of 2015 the industrial products prices index increased for 3,4 %, in April 2016 versus April 2015 - for 1,8%, and only for April 2016 - for 0,5%. For a comparison, it should be noted that in 2015 for January-April the industries products prices increased for 4,2% per annum, in April 2015 versus April 2014 - for 0,8% and only for April decreased for 0,9%.
In monthly view ( for april) the pulse for economic activity was given by agricultural sector, increasing the aggregate volume of products for 54,2% ( against 55,7% growth in April 2016). The other sectors have decreased their volumes in April: energy complex - for 11,4% (against the growth for 5,6% a year ago), indutrial sector - for 7% (versus 4,7% a year ago), construction sector - for 8,8% (versus 9,3 dropdown a year ago), trade sector - for 1,1% (versus 2,2% dropdown a year ago), and services sector - for 0,7% ( versus 2,6% a year ago).
In annual view ( April 2017 to April 2016) the leaders in the growth were the trade sector - 14,2%, and services sector - 10,4%, leaving the industrial sector far behind - 4,3%. At that, the agriculture, construction and energy complex sector were in dropdown - 5, 13 and 10,3% respectively. A year ago, in April 2016 versus April 2015, the leader of the growth was the industrial sector - 13,2%, which was followed by services sector - 7,6%, agricultural sector - 5,4% and trade -0,1%, and the construction sector and energy complex were in negative etrend - for 16,5 and 0,8% respectively.
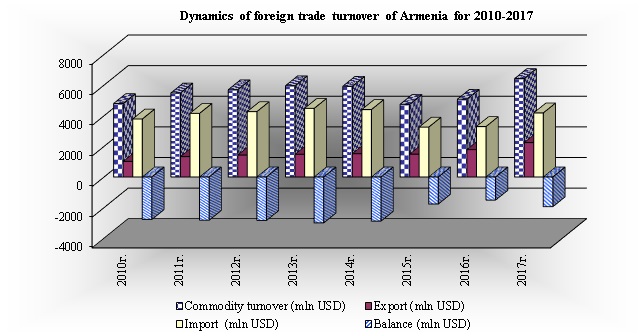
According to the statistics data, in January-April of 2017, the absolute leadership was held by trade sector with ist volume of AMD 685,9 bln (USD 1, 4 bln). The second position in respect to the volume is taken by industrial sector - AMD 485,5 bln ( USD 999.7 mln), the third place is up to services sector - AMD 409.03 bln ( USD 842,3 mln), an the 4th position is taken by agricultural sector - AMD 114,3 bln (USD 235,3 mln). The fifth row is taken by construction sector - AMD 59,2 bln (USD 108,8 mln). The electric power production volume in january-April of 2017 formed 2678,8 mln kw/h, with 577 mln kw/h only in April.
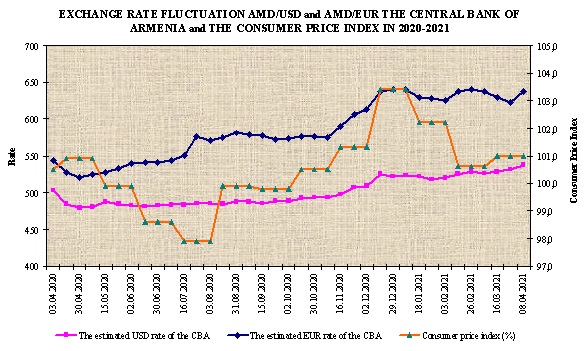
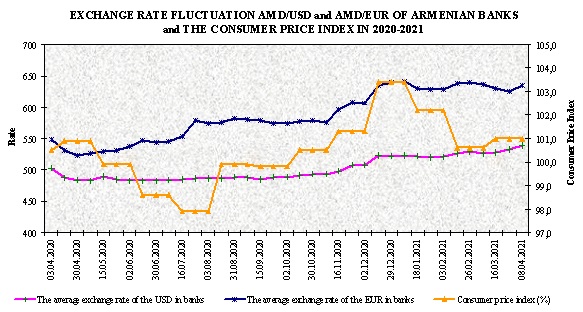
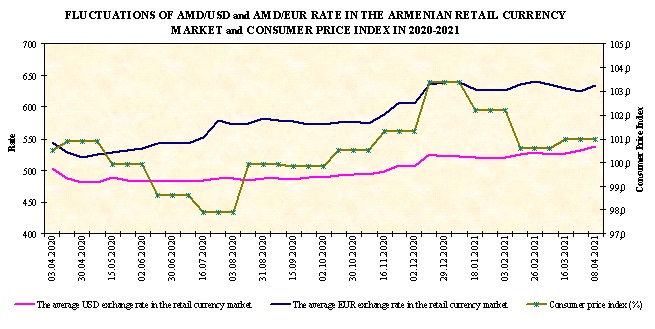
In April 2017, the average forex rate of AMD formed AMD 485,14/USD1, in January-April - AMD 485,62/USD 1, versus AMD 481,27/ USD 1 in April 2016 and AMD 486,82/USD 1 in January-April 2016. In April 2015 the forex rate doremd AMD 474,07/USD 1, and in January-April 2015 formed AMD 476,46/USD1/


 Expert critical of compulsory medical insurance
  Expert comments on medical insurance system in Armenia
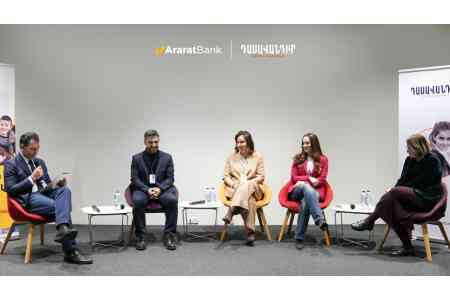
  Mariam Hambardzumyan: Armenia`s education system not adapted to meet the needs of businesses
 ATI.SU: Demand for international cargo transportation 30% up in Armenia
 Civil Contract nominates Armen Ktoyan for Central Bank Board Member position
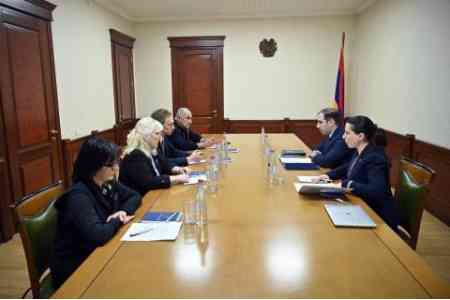
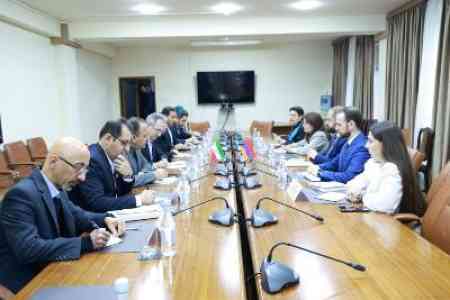
 Armenia, France considering prospects for expanding technological cooperation