


ArmInfo.This July, 9.3% inflation was recorded in Armenia's consumer market against 8.2% inflation last July because of a 12.9% rise in food prices (including prices for cigarettes and alcohol) and an 8.2% rise in nonfood prices, with a 5.7% rise in prices for services. Last July against July 2020, a 13.1% rise in food prices and a 9.6% rise in nonfood prices was recorded, with a 1.8% rise in prices for services.
This January-July, 4.9% inflation was recorded in Armenia's consumer (3.3% inflation last January-July), due to a 4.7% rise in food prices and a 5.1% rise in nonfood prices, with a 4.9% rise in prices for services, against 4.4% rise in food prices, 4.8% rise in nonfood prices and a 1.1% rise in prices for services last January-July. According to the statistical data, 0.7% monthly rise in consumer prices was recorded this January-July against a 0.5% rise last January-July.
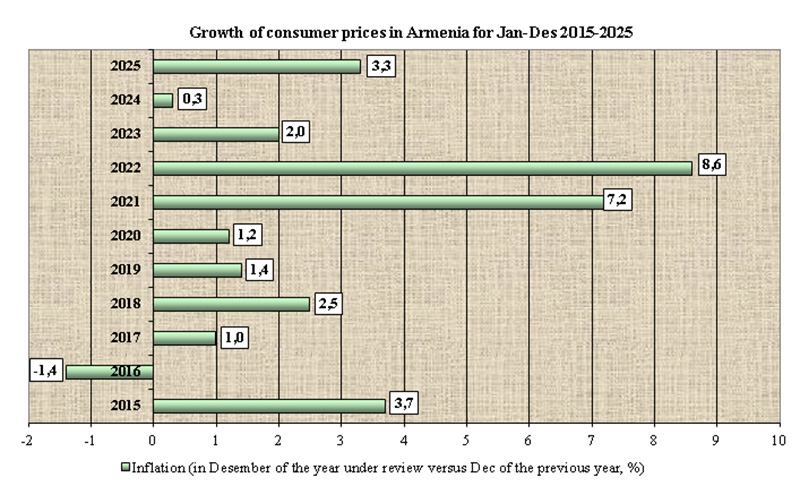
This January-July 8.3% inflation was recorded in Armenia's consumer market against 6.3% last January- July due to a 13.1% rise in food prices and a 6.4% rise in nonfood prices, with a 3.9% rise in prices for services. In January-July 2021, an 8.5% rise in food prices and an 8.2% in nonfood prices, with a 1.9% rise in prices of services, was recorded as compared with January-July 2020.
This July alone, 1.4% deflation was recorded (against 0.3% inflation this June and 0.5% deflation last July) due to a 3.9% decline in food prices (against 1.2% decline last July), with a 0.5% rise in nonfood prices (against a 0.2% decline last July) and a 0.5% rise in prices for services (against 0.1% rise last July). In Yerevan, a 1.3% decline in consumer prices was recorded this July against a 0.6% decline last July.
A 0.9% decline in vegetable prices was recorded this July against last July (after a 53.1% rise the previous year), with a 33.7% rise this July alone. A 53.1% rise in vegetable prices was recorded last year, with a 2.5% decline last July. A 21.7% rise in fruit prices was recorded, with an 8.9% decline this July against an 11.8% and 13% decline respectively in 2021. A 23.78% average weighted decline in vegetable and fruit prices was recorded this July. With an 8.1% share in the basket, fruits and vegetables caused a 1.97% decline in consumer prices.
This January-July against the corresponding period last year, a 31.8% rise in the lentil price, 28.6% rise in the buckwheat price, 12.7% rise in the rice price and a 3.2% rise in the beans price were recorded. A 0.5%- 1.4% decline in prices was recorded this July.
This January-July against the corresponding period last year, a 7.5% rise in the sugar price was recorded (after a 39.4% rise last year), with a 1.6% decline this July alone.
This January-July against the corresponding period last year, an 18% rise in the flour price was recorded, with a 0.5% decline this July alone.
This January-July against the corresponding period last year, a 0.4% rise in the sunflower oil price was recorded, with a 2.5% rise in the butter price, with a 3.7% and a 1.8% decline this July.
The bread and noodles prices showed a 21.2% and a 31.3% rise respectively, with a 1.2% and 1.5% rise recorded this July.
This January-July against the corresponding period last year, the pork and mutton prices rose by 7.1% and 20% respectively, with a 3.7% rise this July.
A 26.2% rise in cheese prices was recorded, with a 2.7% rise this July.
A 20.1% decline in egg prices was recorded, with a 2.7% rise this July.
An 8.3% rise in the prices for fish and sea products, with a 0.2% decline this July.
A 1.8% to 10% rise in prices for wine, bear and vodka was recorded, with a 0.5%-1% rise this July. An 8.6% rise in the price for mineral water and bottled spring water, with 1% rise this July. A 9.1% rise in cigarette prices was recorded, with a 0.1% rise this July. This January-July against the corresponding period last year, a decline in prices for jewelry, gardening tools and medicines was recorded - 6.1%-0.1%, with a 6.1%-3.9% decline in the prices for the former two and a 1% rise in the price for the third group.
This January-July against the corresponding period last year, a 12% rise in coffee, tea and cocoa prices was recorded, with a 0.5% rise this July.
This January-July against the corresponding period last year, clothing prices showed an 11.2% rise, footwear prices, a 10.5% rise, building materials prices, a 10.9% rise, prices for disposable household goods, a 10.6% rise, the price for fuels and lubricants, an 8.3% rise, the furniture price, am 8.2% rise, the price for household appliances, an 8% rise, utensils prices, a 7.8% rise. All the goods showed a price rise this July as well, except for footwear (an 0.8%-1.1% decline). Petrol showed a 0.8% price rise, with a 0.4% decline kin the price for diesel fuel.
This July against last July, the petrol and diesel fuel prices rose by 11.6% and 43.2% respectively (against a 56.8% and 43.6% rise respectively the previous year). This January-July against the corresponding period last year, a 32.8% rise in the diesel fuel was recorded, with a 2.9% rise in the petrol price, with a 31.2% and 39.5% rise respectively last January-July.
As regards prices for services, a 24.9% rise was recorded in recreation and entertainment prices (0.2% decline this July) was recorded, organization of sporting events showed a 20.5% rise (a 5.7% rise this July). Transport services showed a 12.9% rise (a 1.4% rise this July), the services sector showed a 9.2% price rise (1.2% rise this July), housing repair, an 8.6% price rise (3.1% rise), postal service price, a 7% rise, with a 5.1% rise in the pre-school and primary education services.
Hotel services showed a 5.5% price rise (with a 2% price rise this July), services of hairdressing and spa saloons showed a 5.1% rise (0.1% rise this July), with a 2.4% rise in medical services, (0.1% rise this July). Laundry and clothing mending services showed a 6.5% price rise, with a 1.8% rise this July. Shoe repair services showed an 8.5% and 6.1% rise respectively. Financial services showed an 11.4% rise, with 3.6% rise this July.
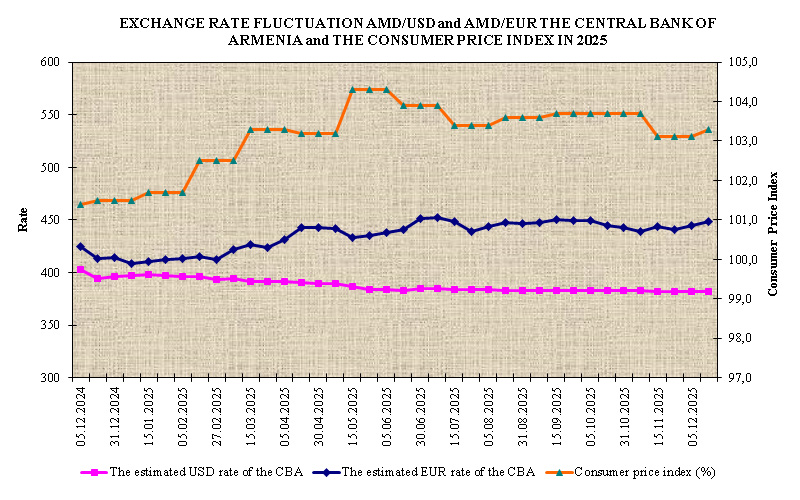
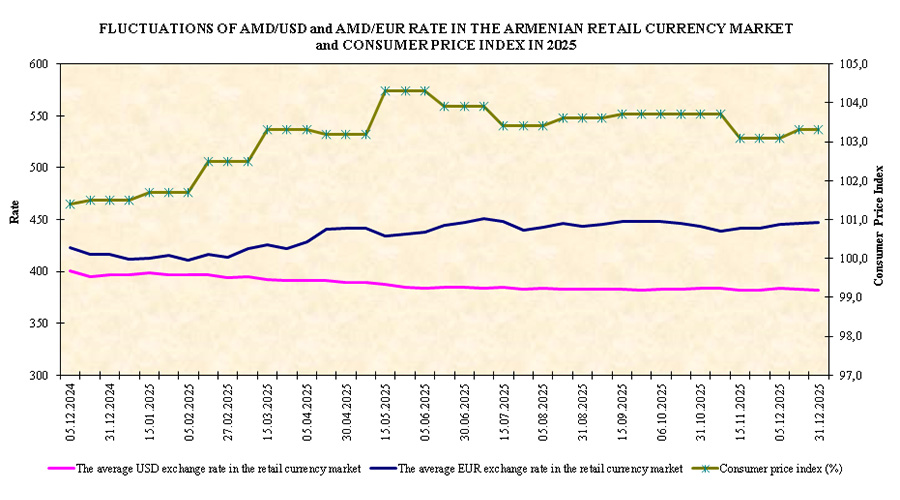
This July, the 1.4% deflation in the consumer market was accompanied by 2.8% AMD appreciation against the USD (against 0.5% deflation and 4.3% AMD appreciation against the USD last July). This January- July, 4.9% inflation in the consumer market was accompanied by 15.3% AMD appreciation against the USD (against 3.3% inflation and 5.4% AMD appreciation against the USD last year). This July against last July, 16.3% AMD appreciation against thee USD was recorded, to AMD 411/$1, with 9.3% inflation (against 1.3% depreciation, with 8.2% inflation).
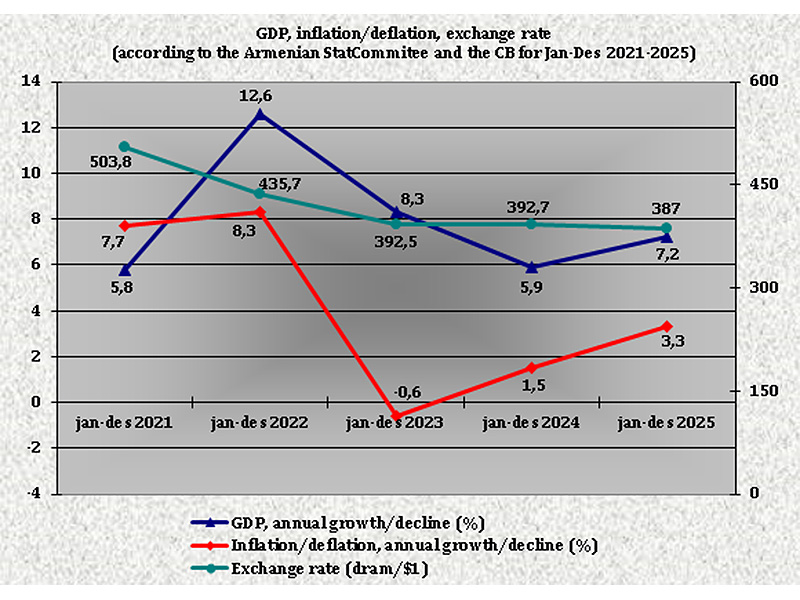
The inflation target is 4% (+/-1.5) for 2022. According to the CBA's June forecast, 8.5% inflation is expected in Armenia this year against 6.6% forecast this March and 7.7% actually recorded in 2021. the CBA forecasts 4% inflation.